Signal attenuation through materials#
Summary#
This application note looks at how different materials affect the performance of the Novelda sensors.
Introduction#
The Novelda UWB radar sensors emit electromagnetic (EM) waves. When these EM waves hit objects some of the energy is reflected and some of the energy will penetrate through the object. How much energy propagates through depends on the material properties of the object. This behavior is important to consider as it may lead to walls looking partly transparent to the sensor and make the sensor detect movements on the opposite side of a wall.
This application note takes a practical approach to the signal loss caused by different types of building materials. A known radar reflector was set up in front of the X4F103 module and the reflected signal was recorded with and without building materials in the signal path. The difference is reported as two-way signal attenuation as the signal passes through the material twice.
Measurement setup#
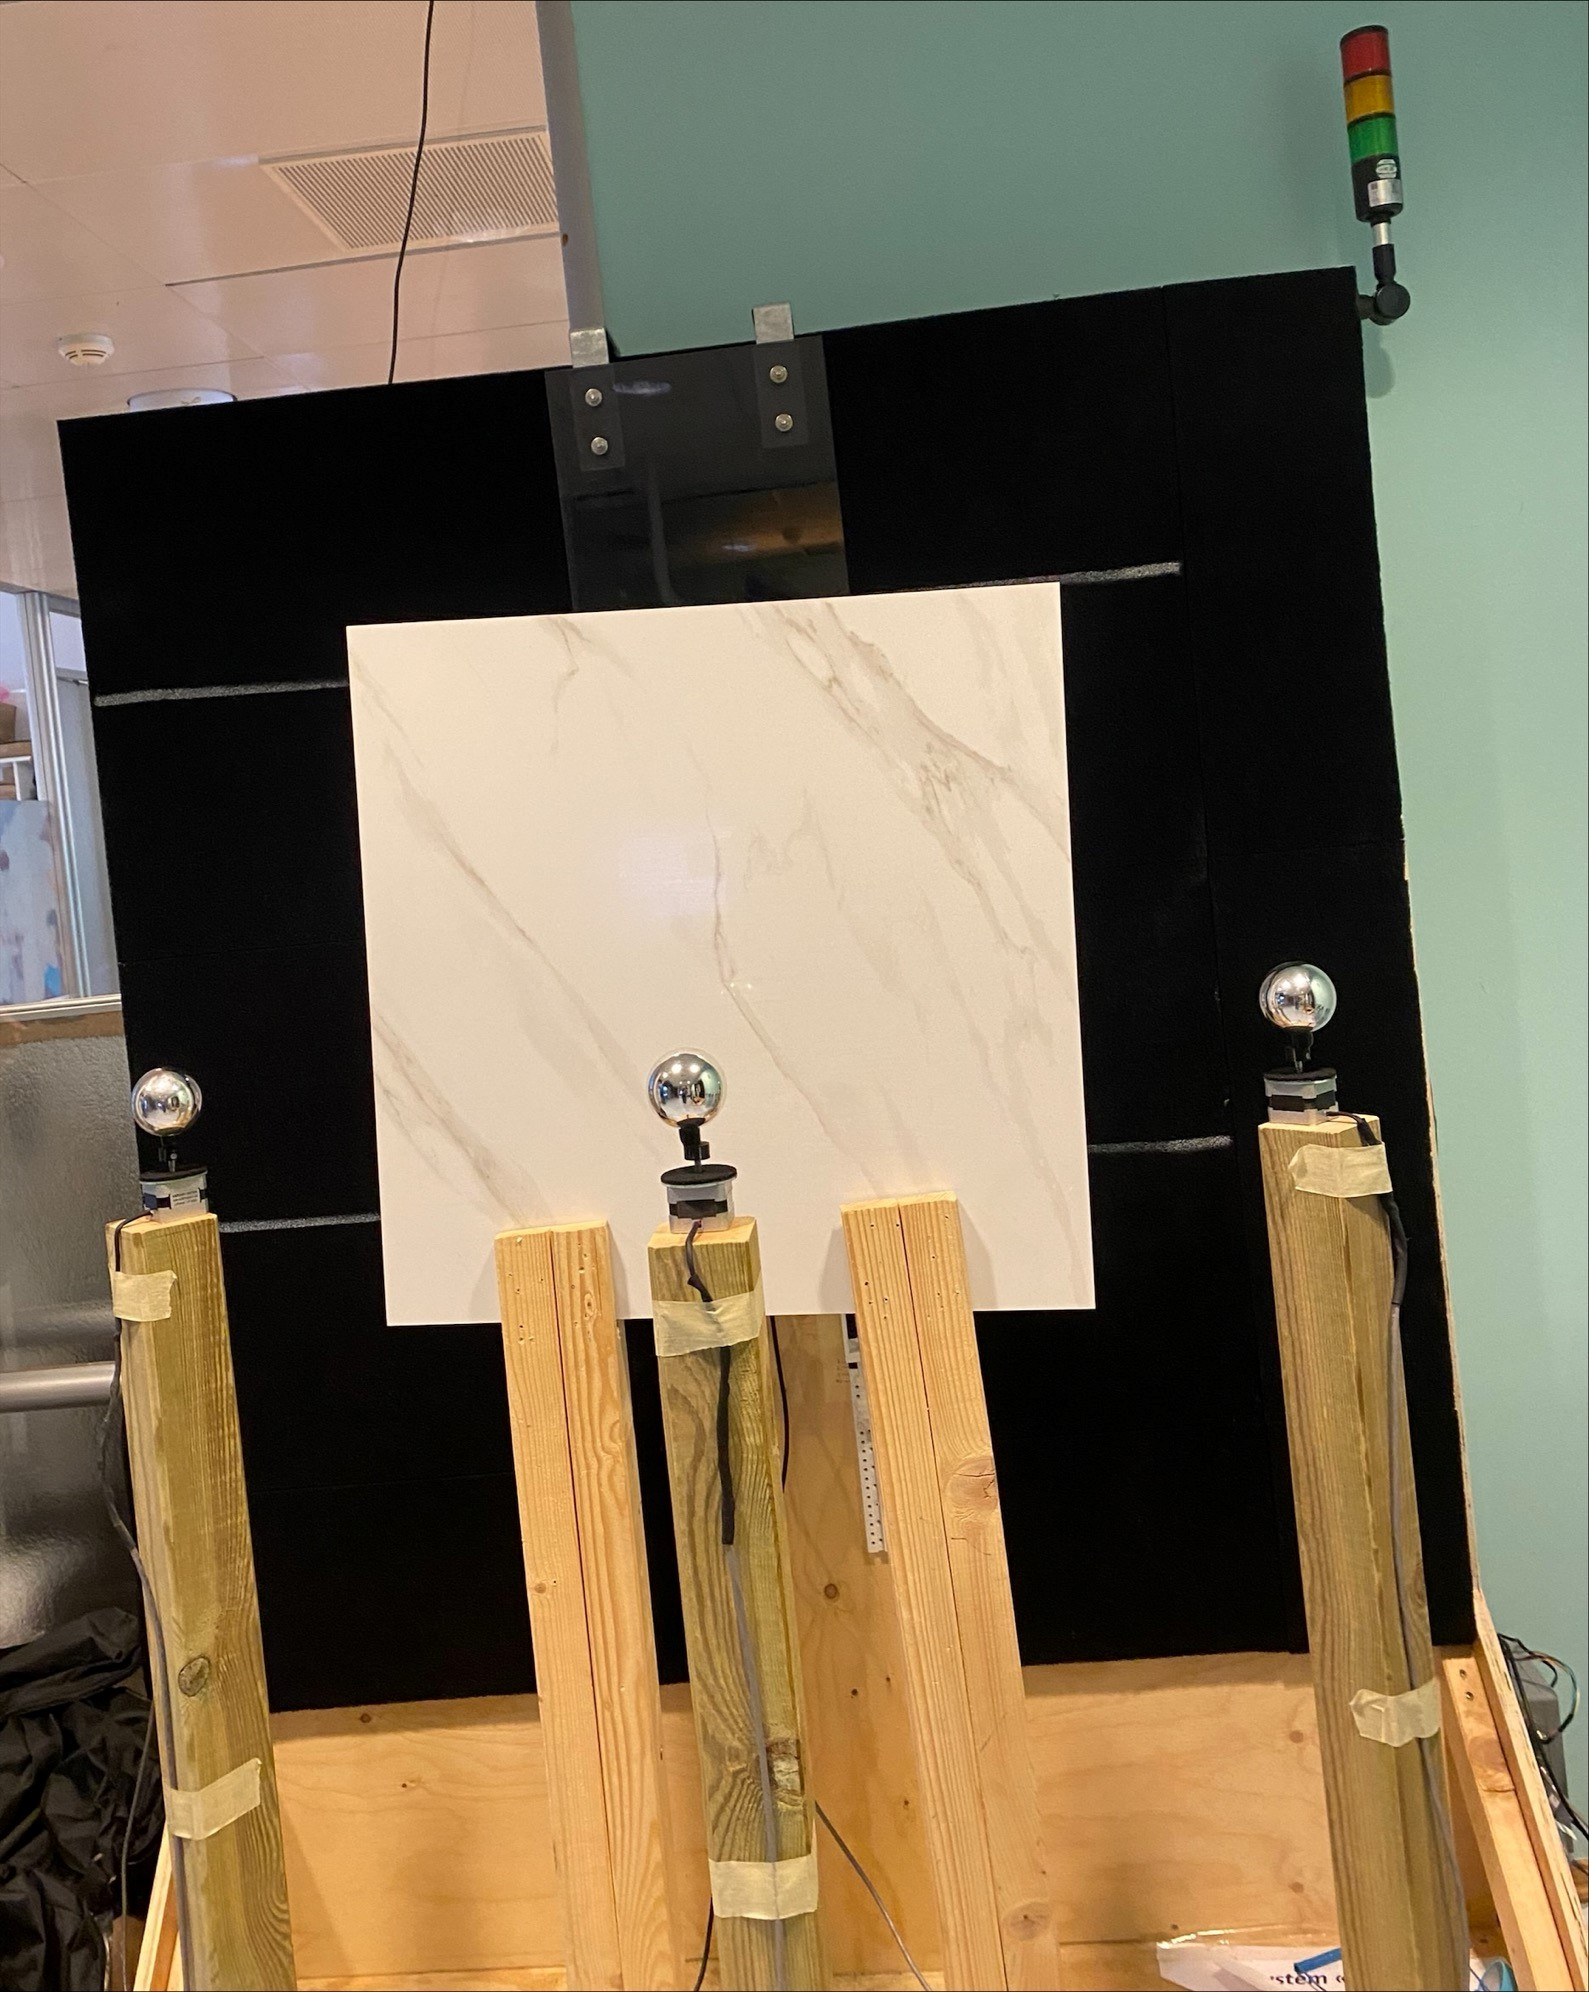
The X4F103 was mounted in Novelda ́s characterization setup shown below. The radar target is an offset rotating spherical reflector (ø 6 cm) at 65 cm distance from the sensor. Only the center target was rotating during this test. The building material under test was placed between the sensor and the target at 40 cm distance from the sensor. This distance was chosen to be larger than one pulse width, to avoid interference and reduce multipath.
The rotating target has a Radar Cross Section (RCS) equivalent to human breathing motion at the X4F103 center frequency (7.58 GHz).
The measurements will not distinguish between loss due to reflection from the building panels and loss through the material, but give the total loss caused by the object. The signal processing employed in the detection algorithm treats reflections from static objects on the material’s surface as a form of signal loss. Figure 1 - Measurement setup. The sensor is mounted in the center of the back wall (middle of grey area). The material is positioned between the sensor and radar target (spheres).
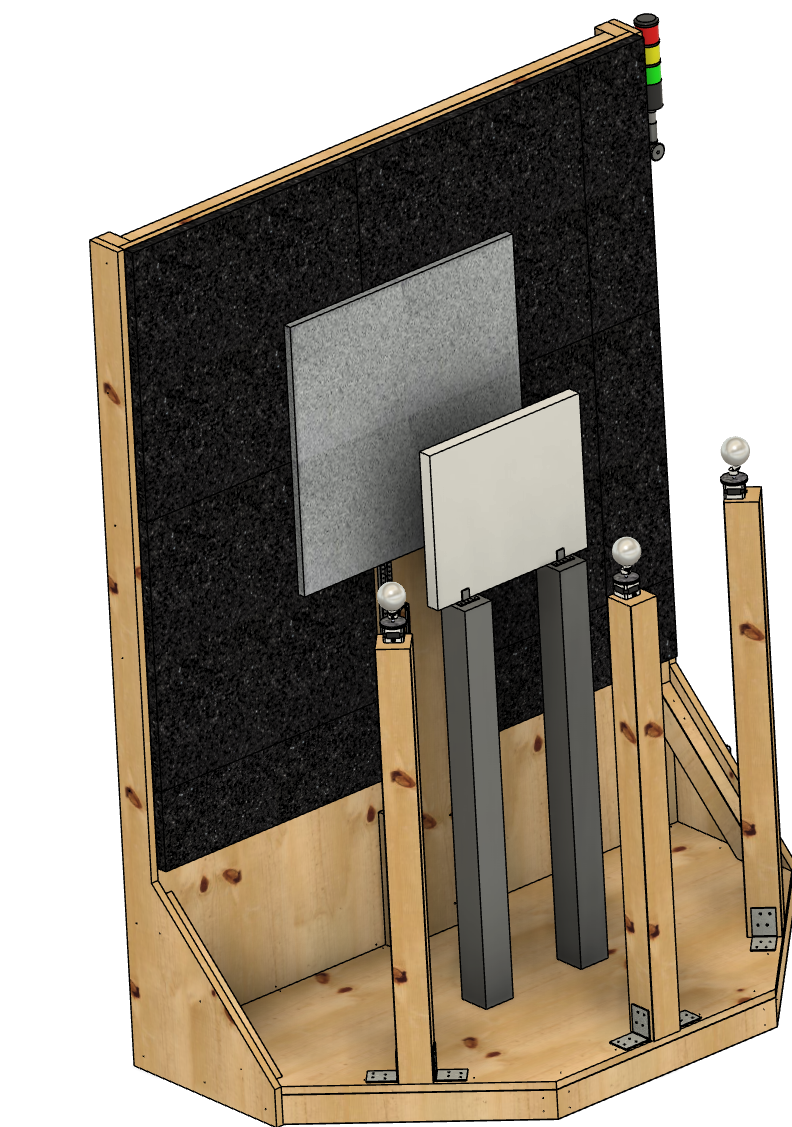
Measurement setup. The sensor is mounted in the center of the back wall (middle of grey area). The material is positioned between the sensor and radar target (spheres).#
Results#
The measurements conducted here aim to assess the two-way signal attenuation when penetrating various materials. These tests involve comparing the signal’s peak power in dB without any material obstructing the sensor, serving as the reference point. The deviation in signal peak power between the reference test and when materials are introduced determines the loss in signal power caused by the material attenuation.
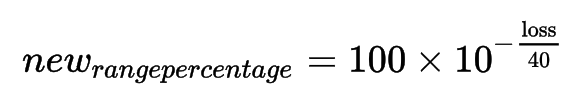
The Novelda sensors requires a minimum signal to noise ratio (SNR) to be able to detect presence. In most situations for Proximity and Occupancy the typical human motion in the detection zone will be such that the received signal strength is high making SNR much higher than SNRminimum. Some use cases will however reflect less signal power back to the sensor. These could be smaller movements with Proximity or Occupancy use cases with range more than approximately 3.5 meters. In such cases the SNR may be close to, or at, SNRminimum and loss to the signal strength may lead to reduced detection range (the sensor is no longer limited by the configured range, but by the SNR). In such cases the equation below can be used to calculate the new range limit based on a certain loss assuming the reference point is SNRminimum at the configured range
Material |
Picture |
Dimensions (l x w x t) |
TargetPower (dB) |
Two-way attenuation (dB) |
Available range (%) |
|---|---|---|---|---|---|
No material |
see above |
NA |
30.77 |
0 |
100 |
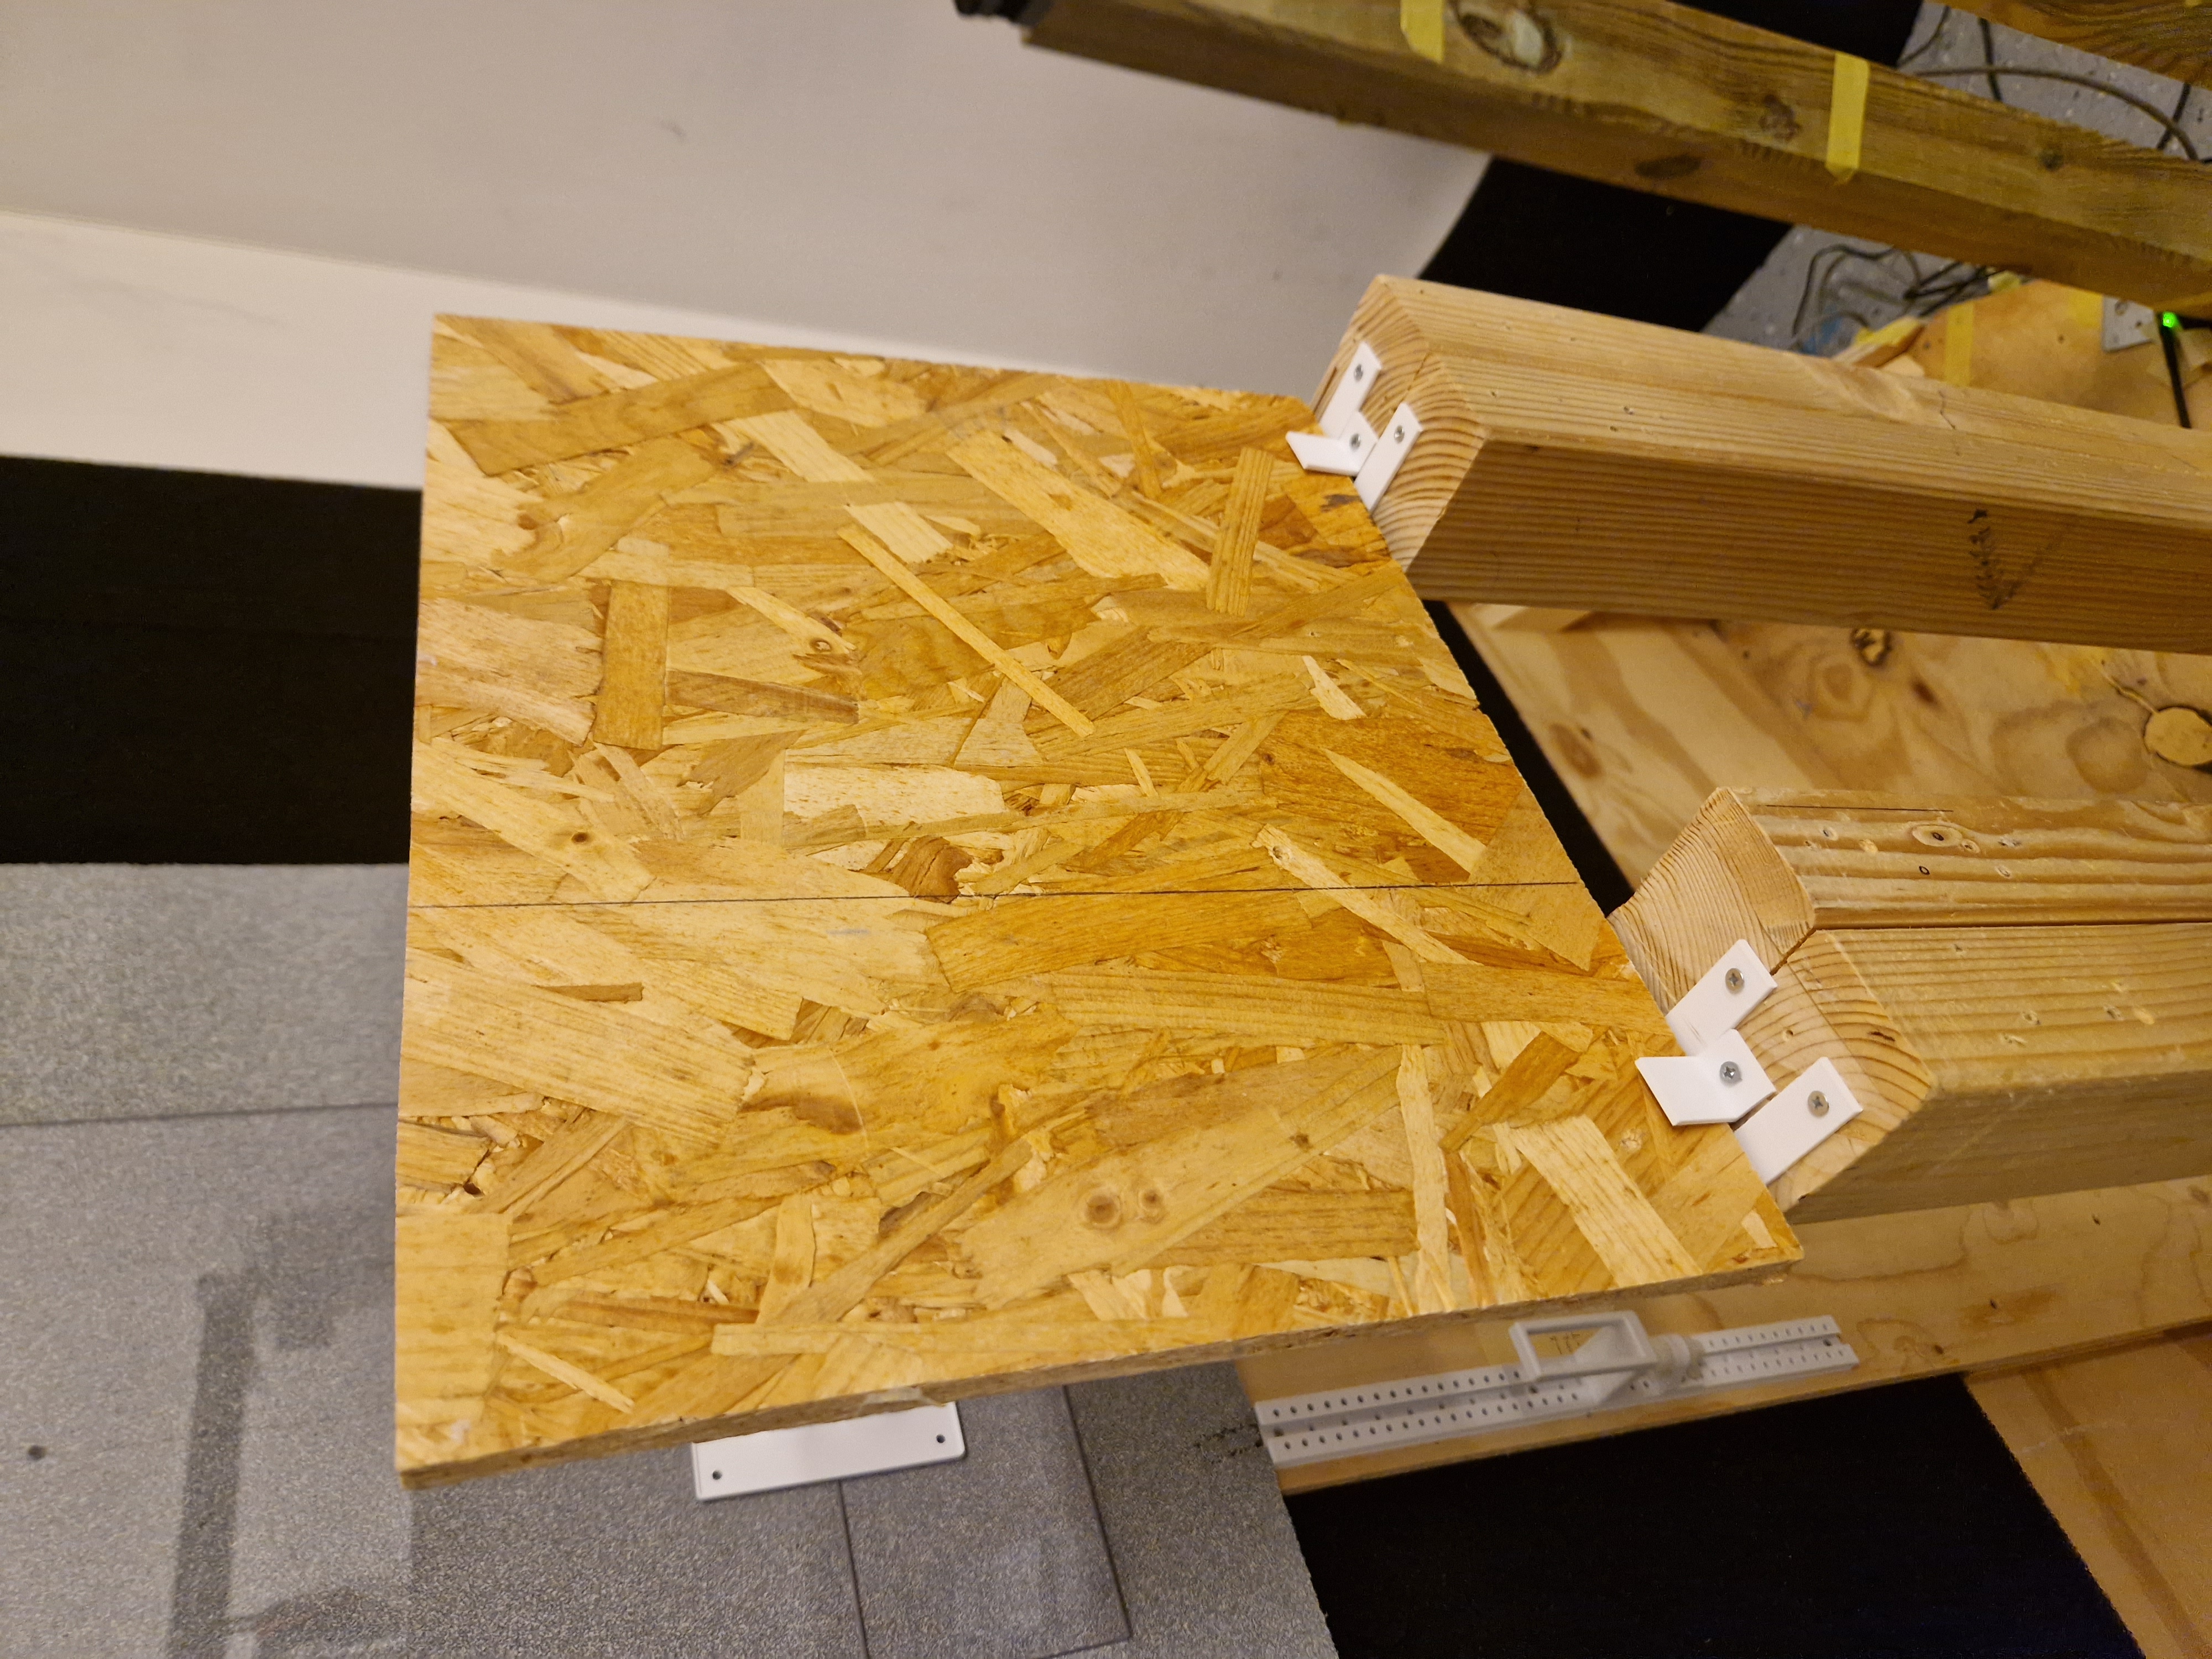
Wood |
|
300 x 350 x 12 (mm) |
29.09 |
1.68 |
90.78 |
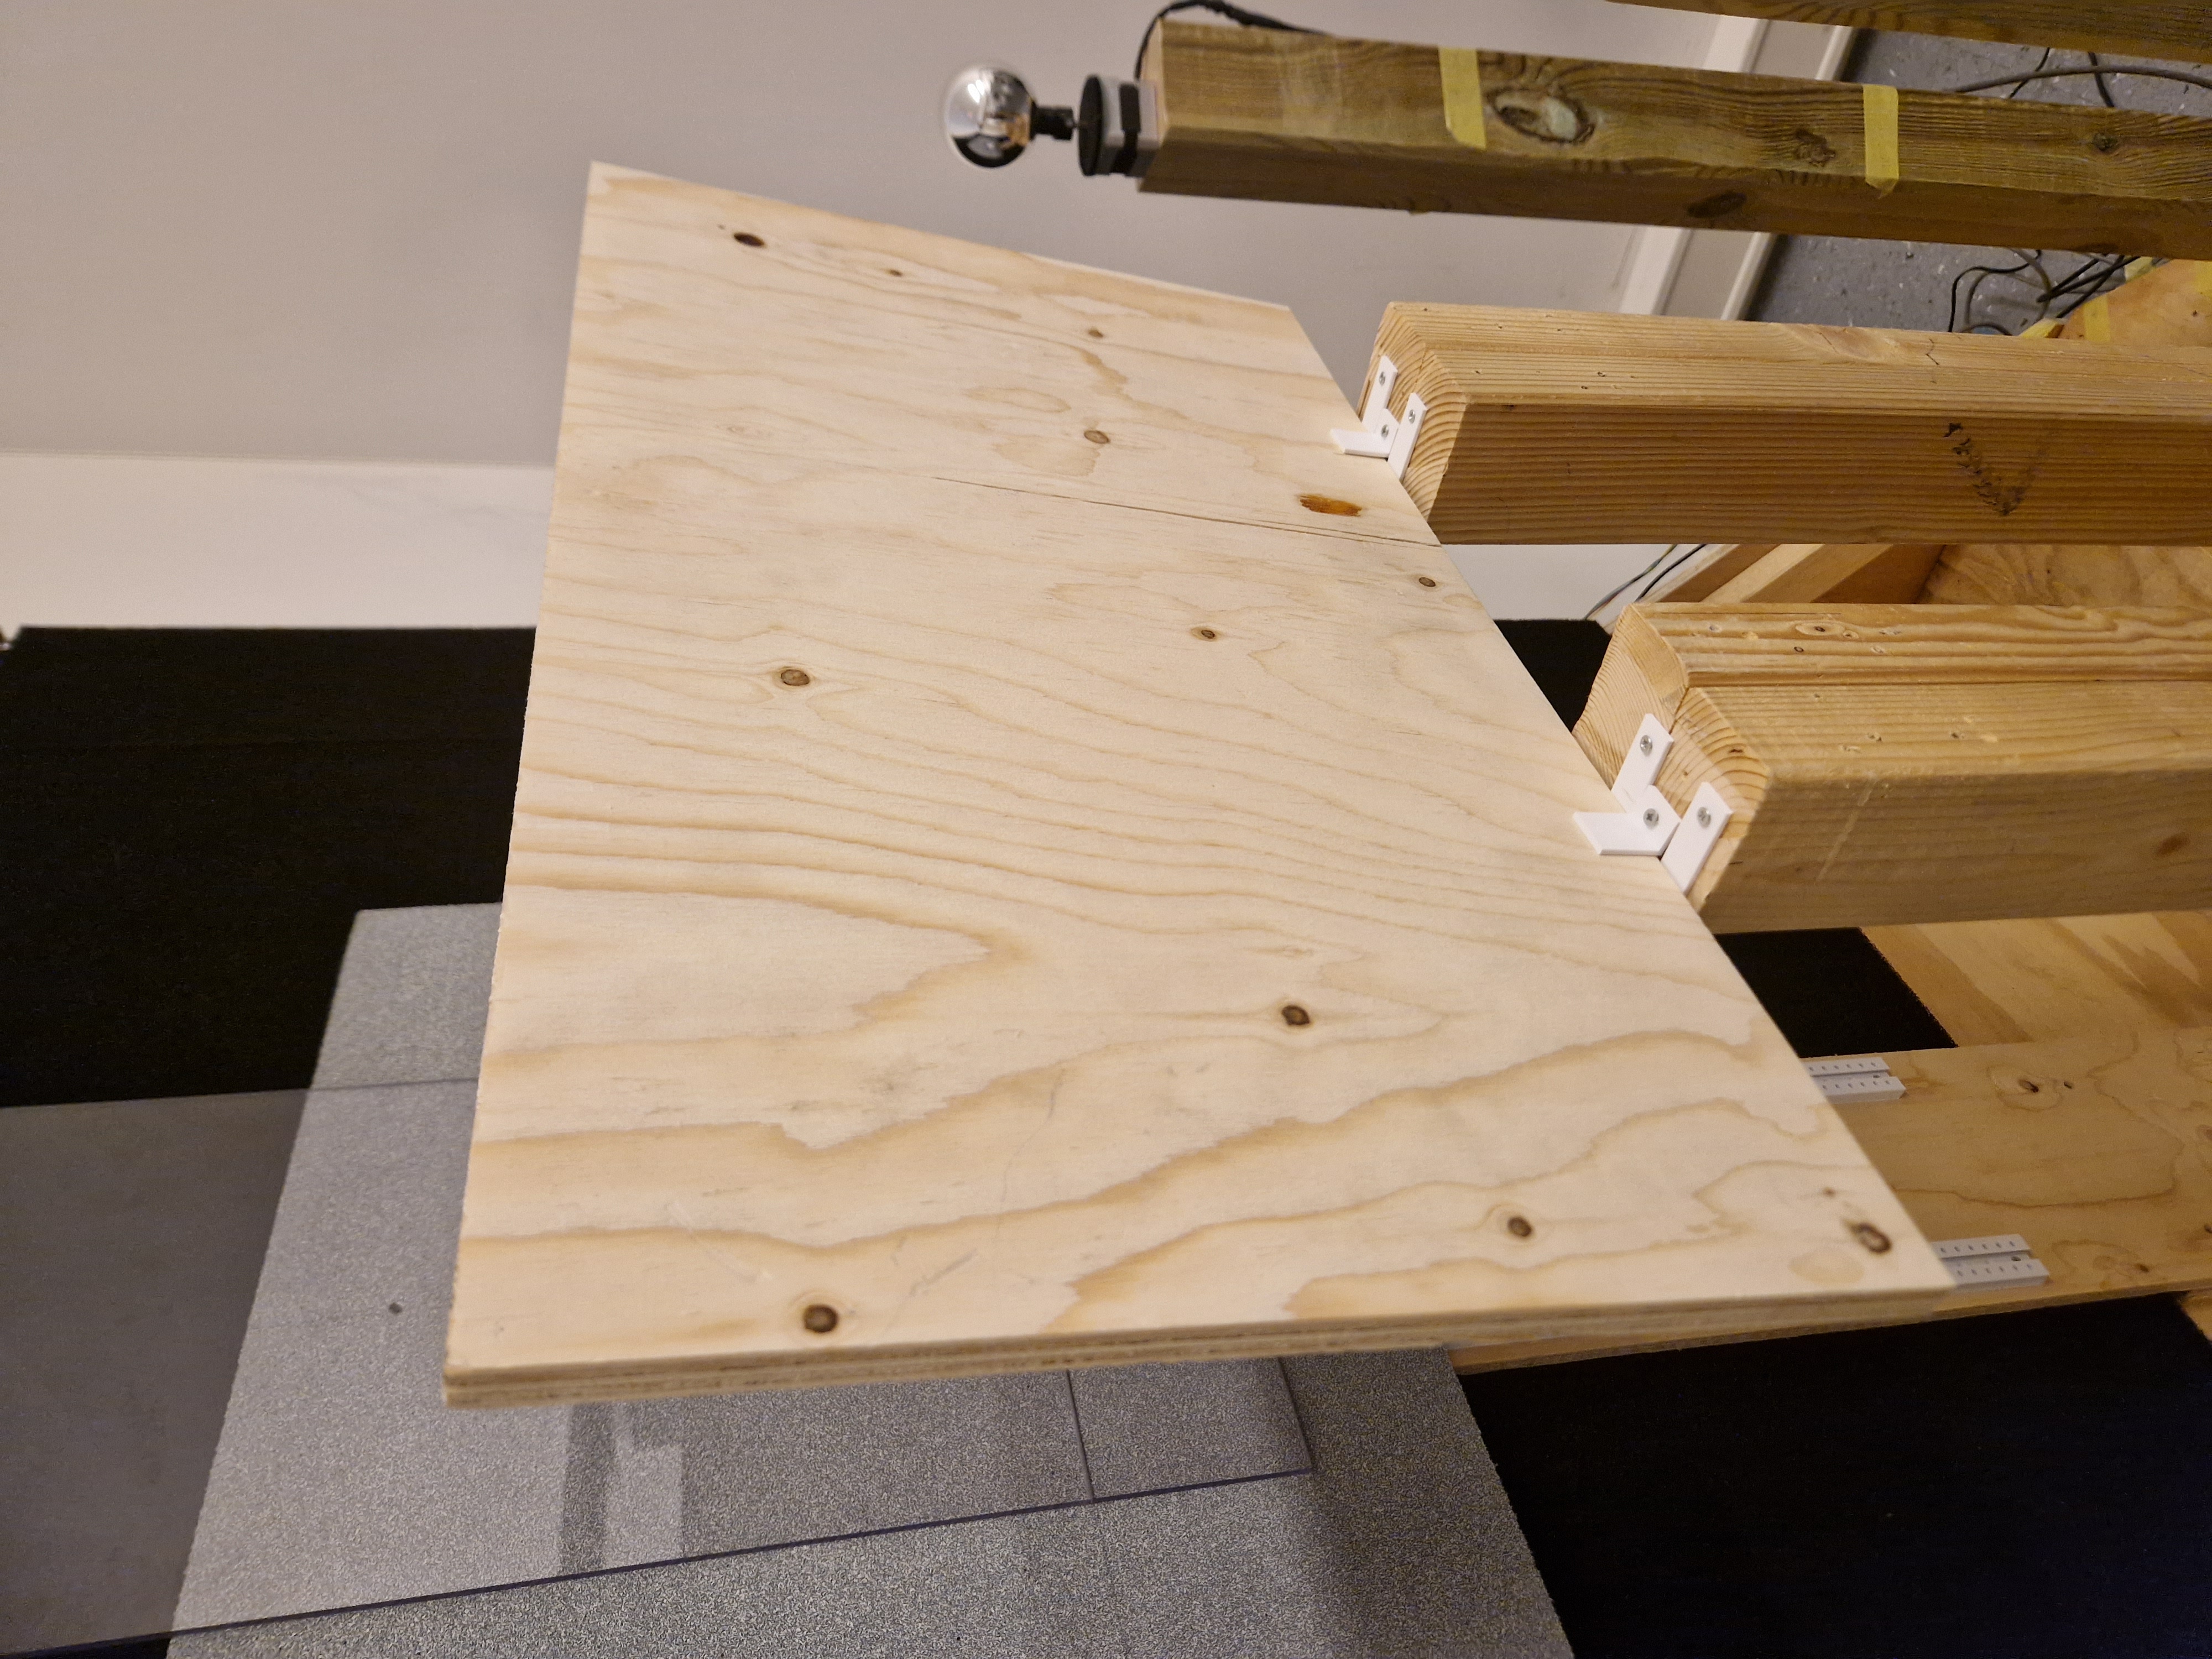
Pine |
|
28.5 |
2.27 |
87.75 |
|
Drywall |
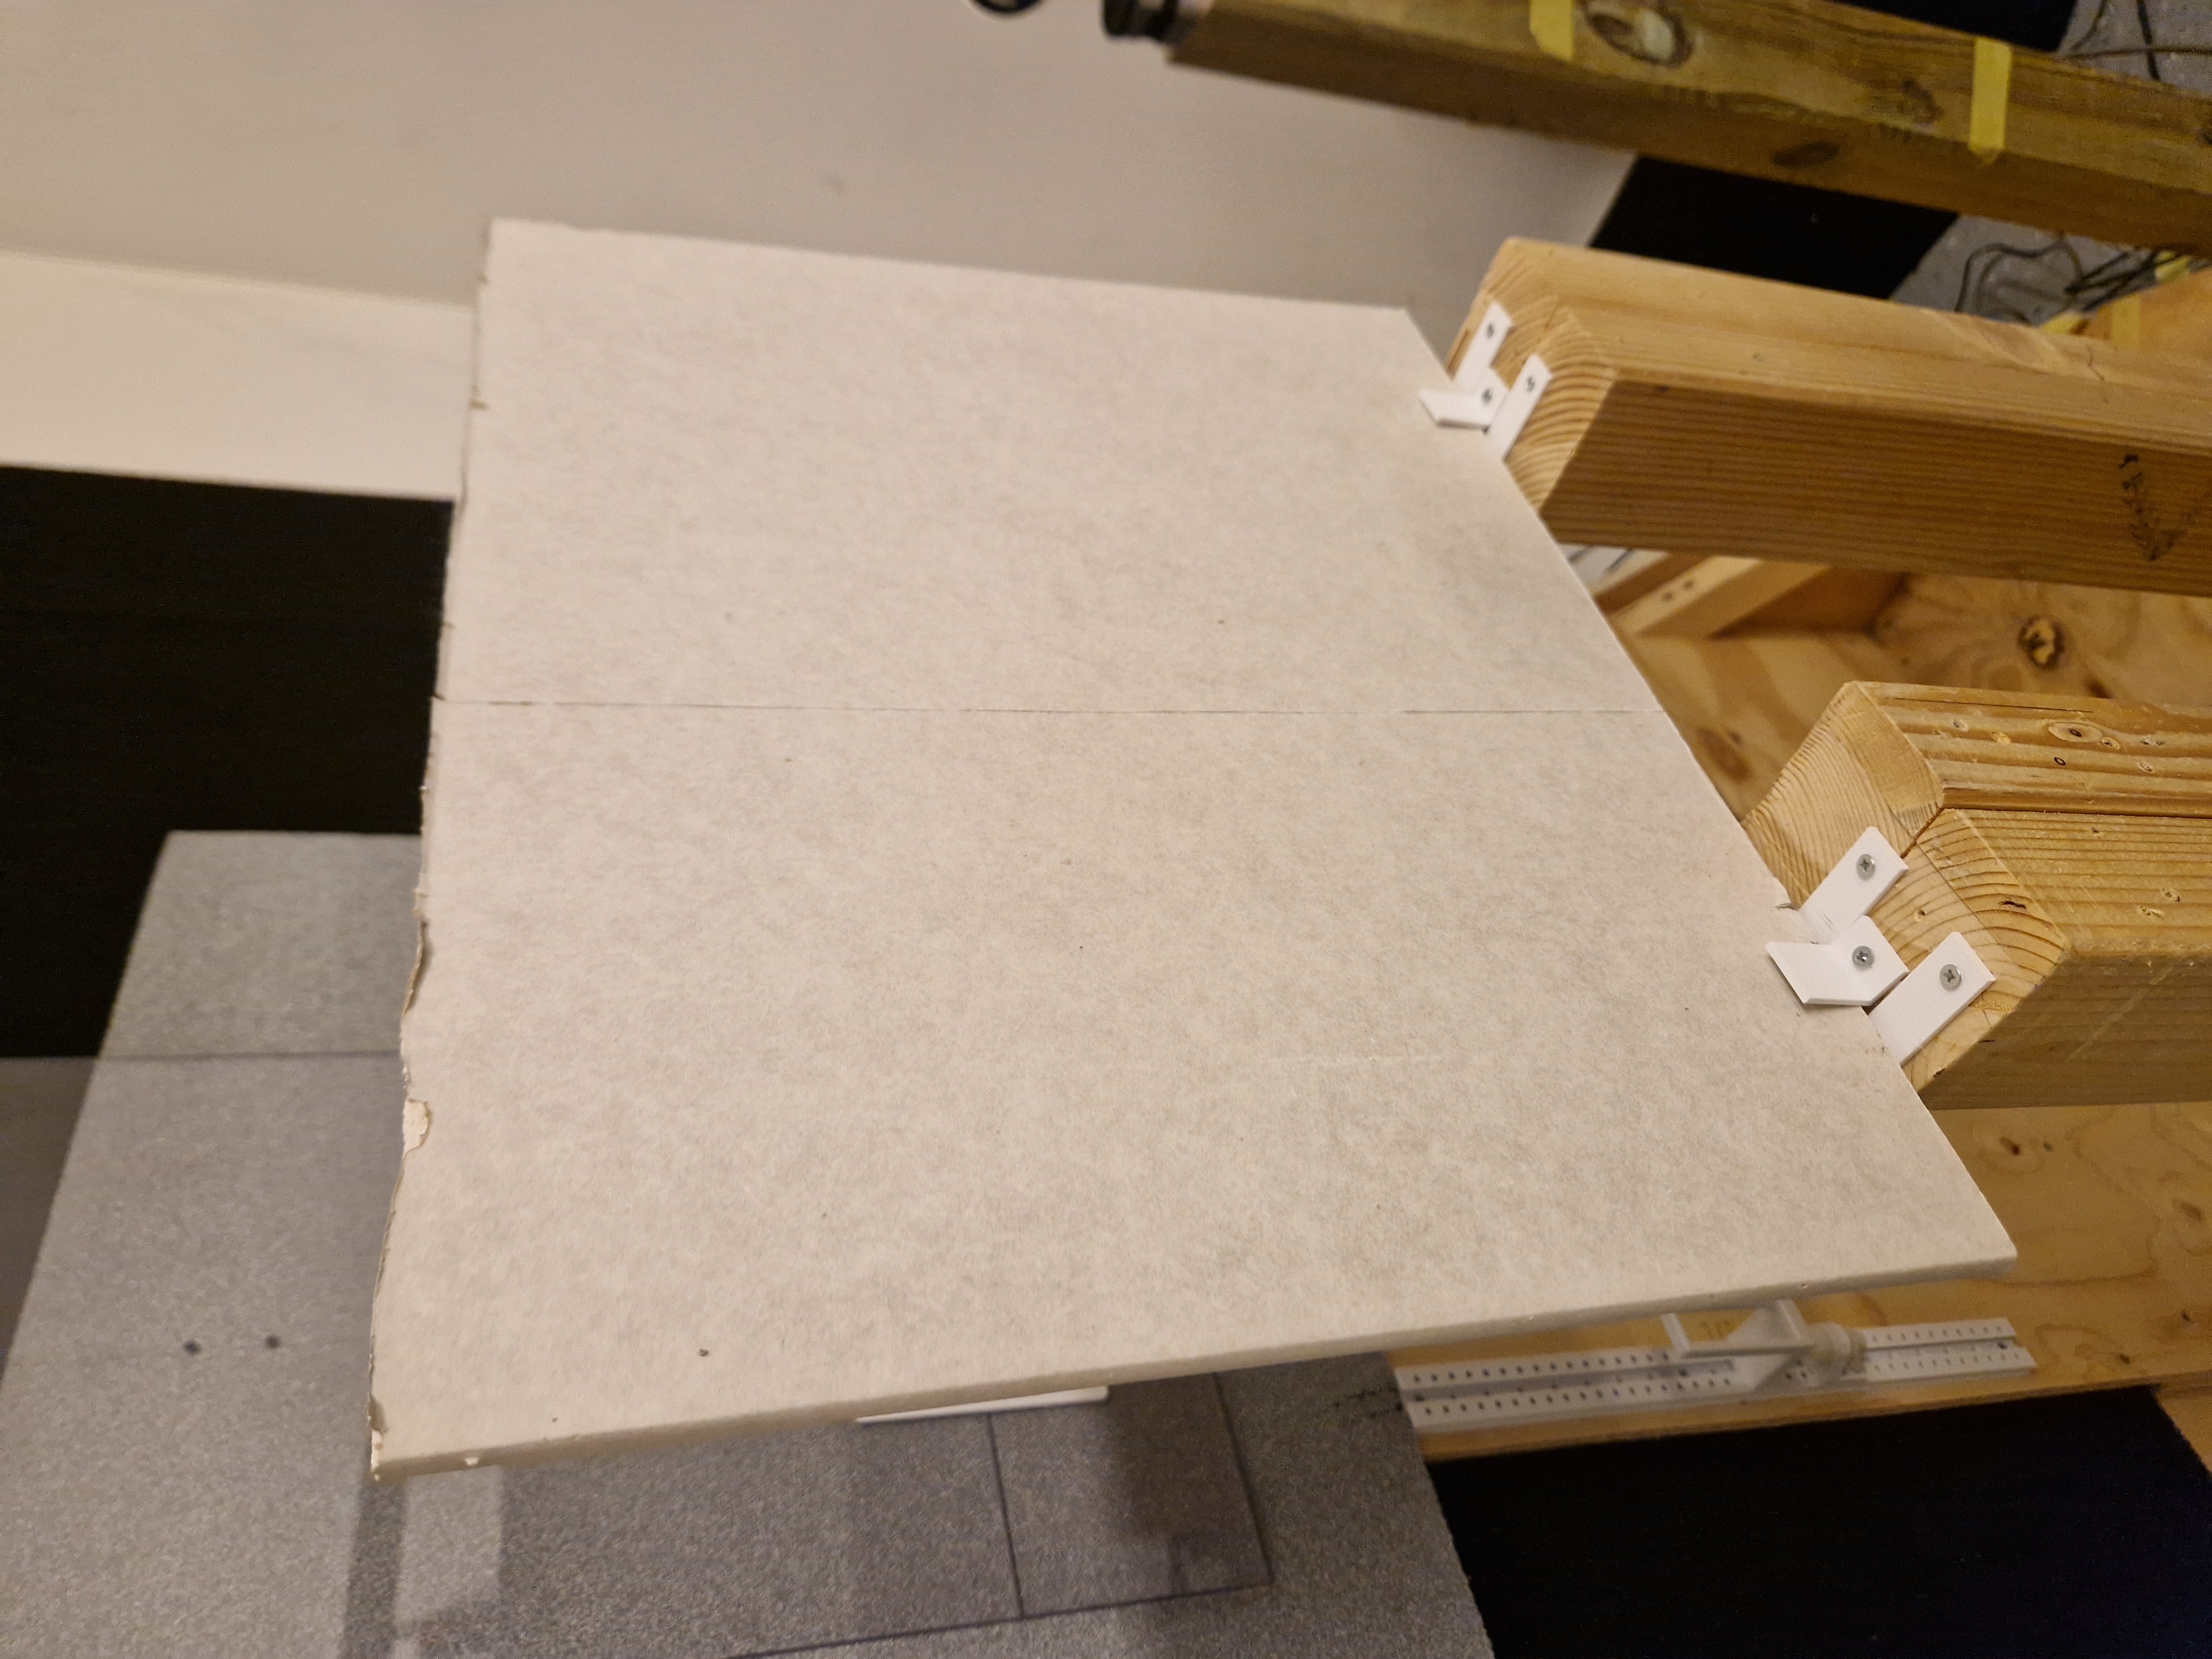
|
430 x 710 x 12 (mm) |
30.21 |
0.56 |
96.83 |
Plastic |
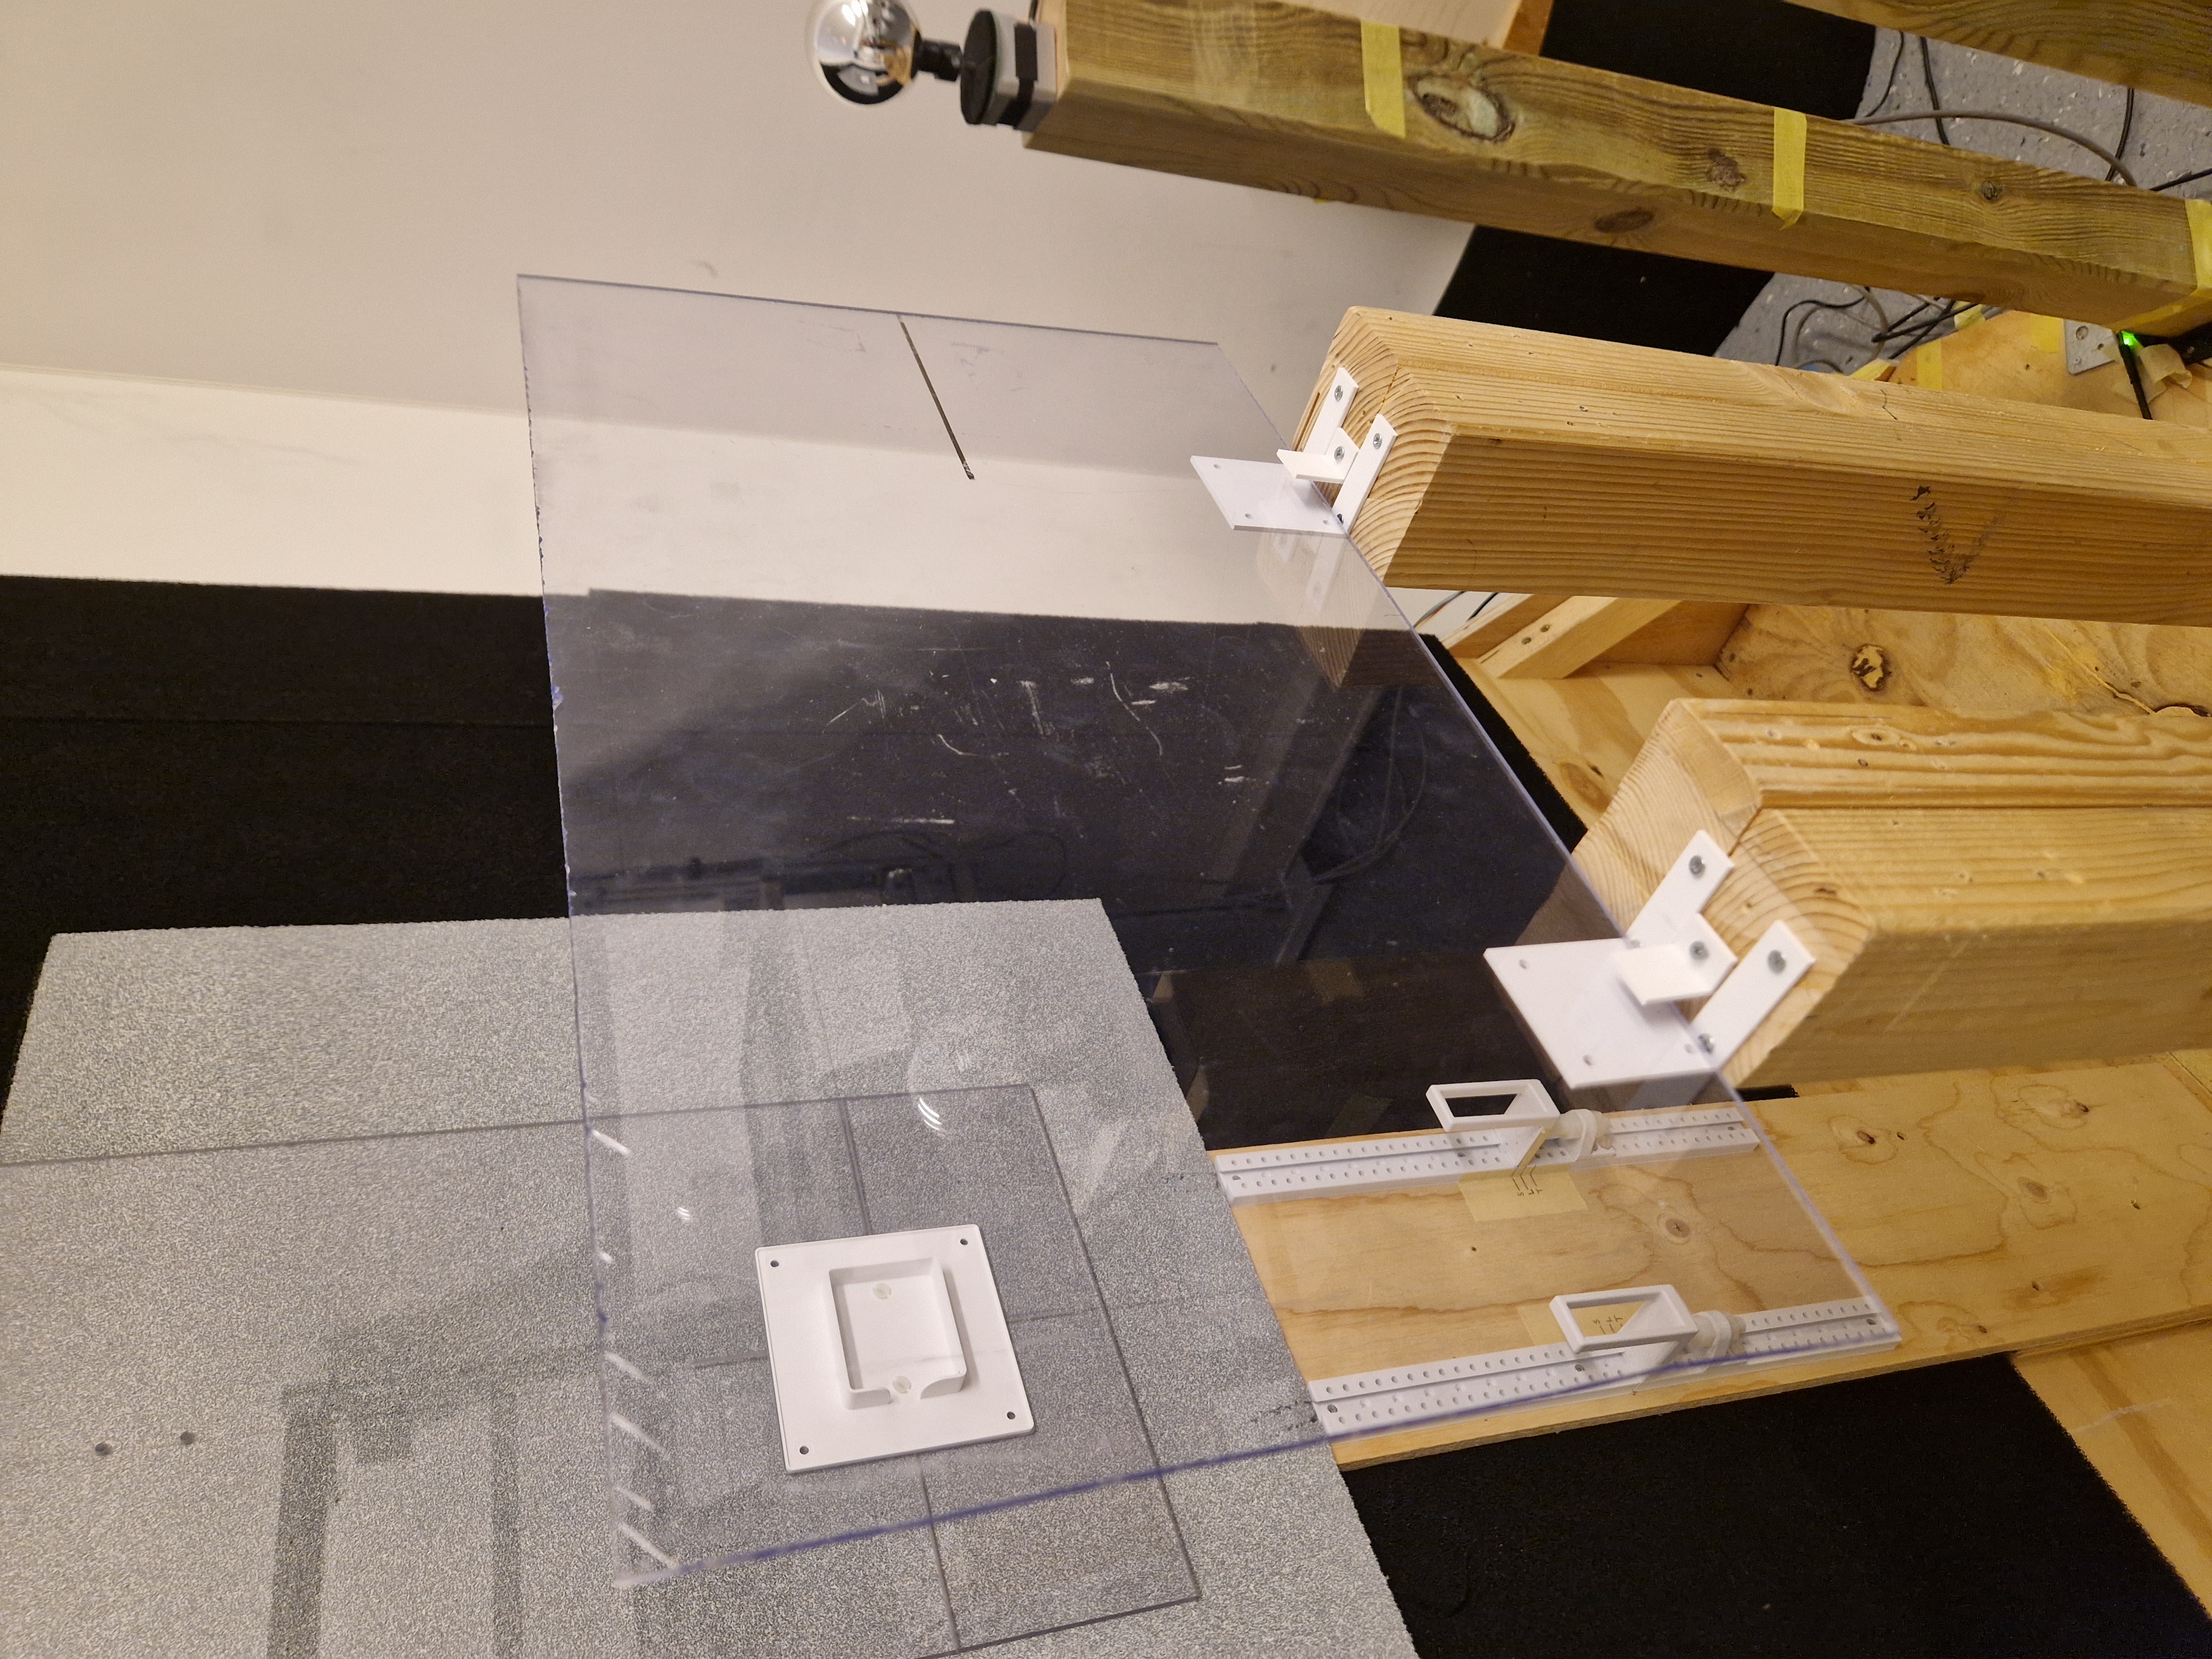
|
500 x 300 x 4 (mm) |
29.42 |
1.35 |
92.52 |
Foam/absorber |
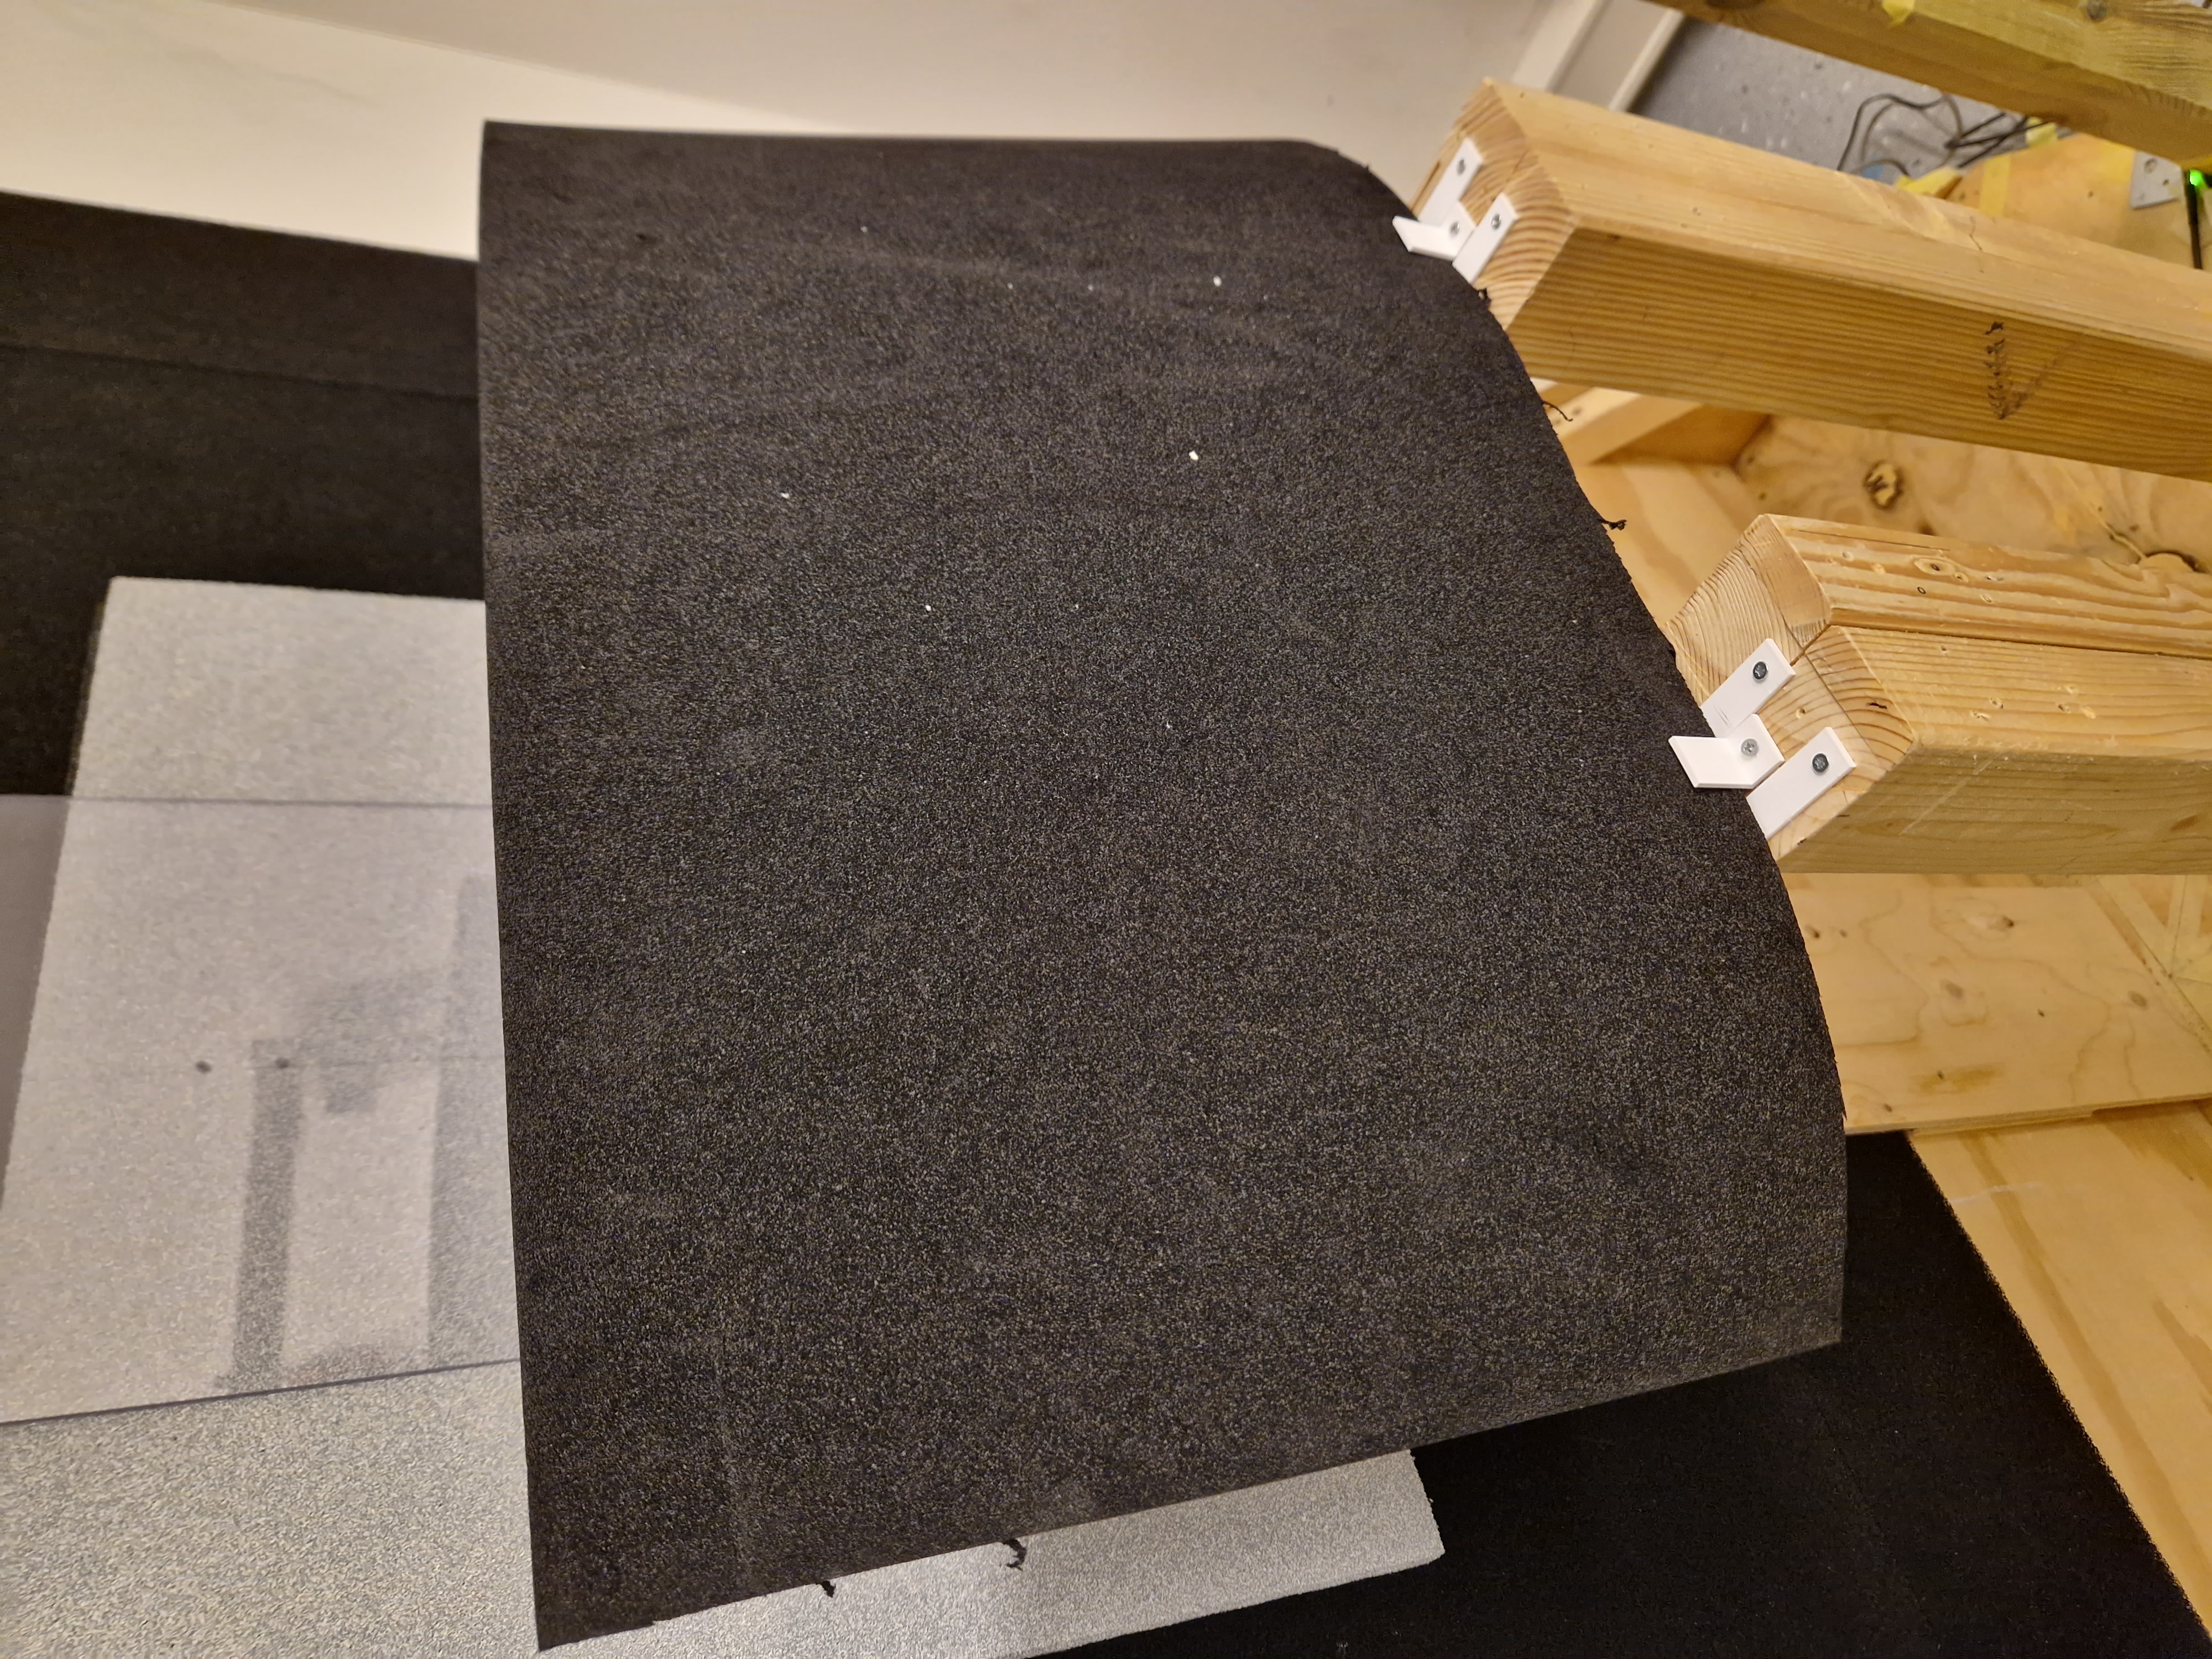
|
670 x 370 x 7 (mm) |
29.98 |
0.79 |
95.5 |
Porcelain |
|
60 x 60 x 10 (mm) |
28.36
|
0.81 |
95.44 |
Conclusion#
The tested materials generally gives very low attenuation of the signal power. This can be leveraged by the end application by making it possible to hide the sensor behind various materials with low impact on detection performance. It must also be taken into account for the end application since the sensor may detect through walls and other physical obstacles.