X4F103 Mechanical integration guide#
Summary#
This document describes best practices and considerations for mechanical integration of the X4F103 sensor module.
Abstract#
This document provides insight into the impact of mechanical integration on the performance of the Novelda X4F103 sensor. The information is meant to complement the general integration guidelines outlined in the X4F103 datasheet.
A key component of the module is the integrated PCB antenna which is vital for proper sensor performance. While the sensor antenna is designed to be robust, it can still be affected by (non-conductive) material in front of the sensor and metallic/conductive parts in the vicinity of the sensor. Interference from other wireless signals, especially high-frequency Wi-Fi can cause signal disturbances.
This document outlines testing done for various materials in front of the sensor with a focus on typical materials used for product enclosures; various ground plane sizes on the PCB carrying the sensor as well as on metallic parts to the side of the module. Additionally, the document provides guidelines for integrating the sensor in proximity to Wi-Fi antennas/routers.
Materials in front of the sensor#
Introduction#
Testing was performed using the Novelda X4F103 sensor, where multiple materials with various thicknesses were positioned in front of the sensor. The materials and their respective thicknesses are presented in the table below. Materials in front of the sensor can affect the gain of the antenna which affects the signal strength of the target(s) in the detection area, as well as the field of view of the sensor.
Material |
Thickness (mm) |
Airgap (mm) |
|---|---|---|
3D Printed ABS plastic |
5, 10 |
2, 10, 20 |
Gorilla glass |
0.5 |
2, 5, 10, 20 |
Results#
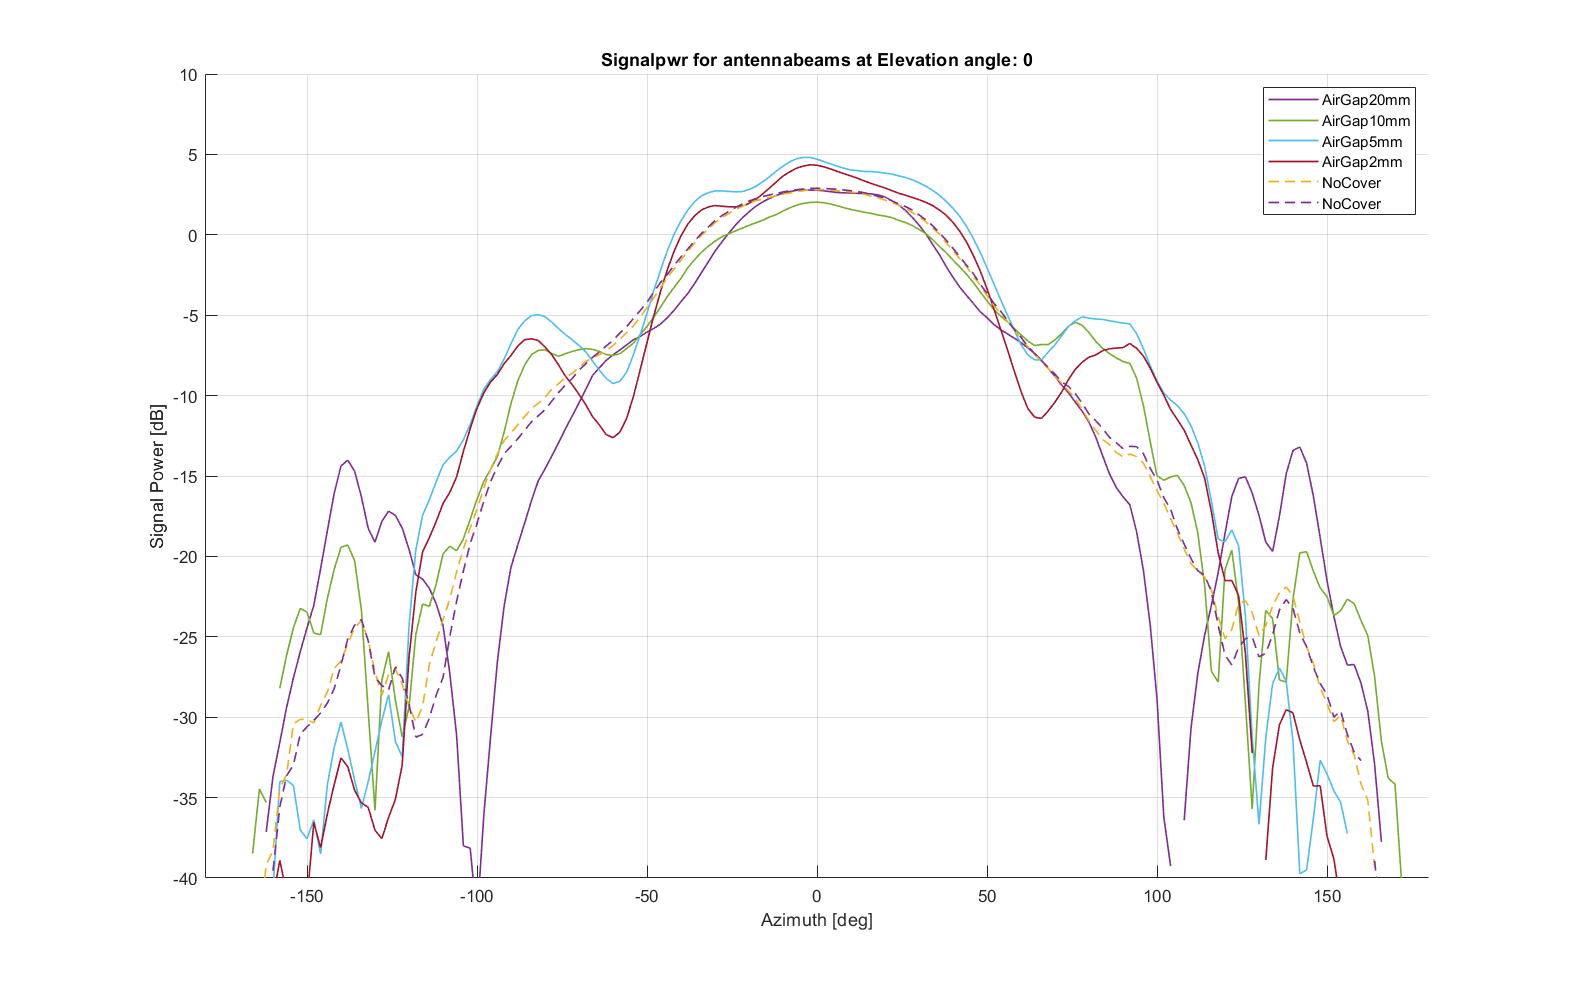
The plots below show the signal strength of a calibrated radar target (spherical, rotating reflector at a fixed distance) at various azimuth angles (the horizontal plane when the sensor is mounted vertically). Each plot contains a reference measurement which is taken with no material in front of the sensor for comparison. First, results from ABS printed plastic of varying air gap (the gap between sensor and material) and thickness are presented. Thereafter, results from Gorilla glass with varying air gaps are presented. For the Gorilla glass, only one thickness was tested.
ABS-printed plastic#
Airgap 10 mm (varying material thickness)
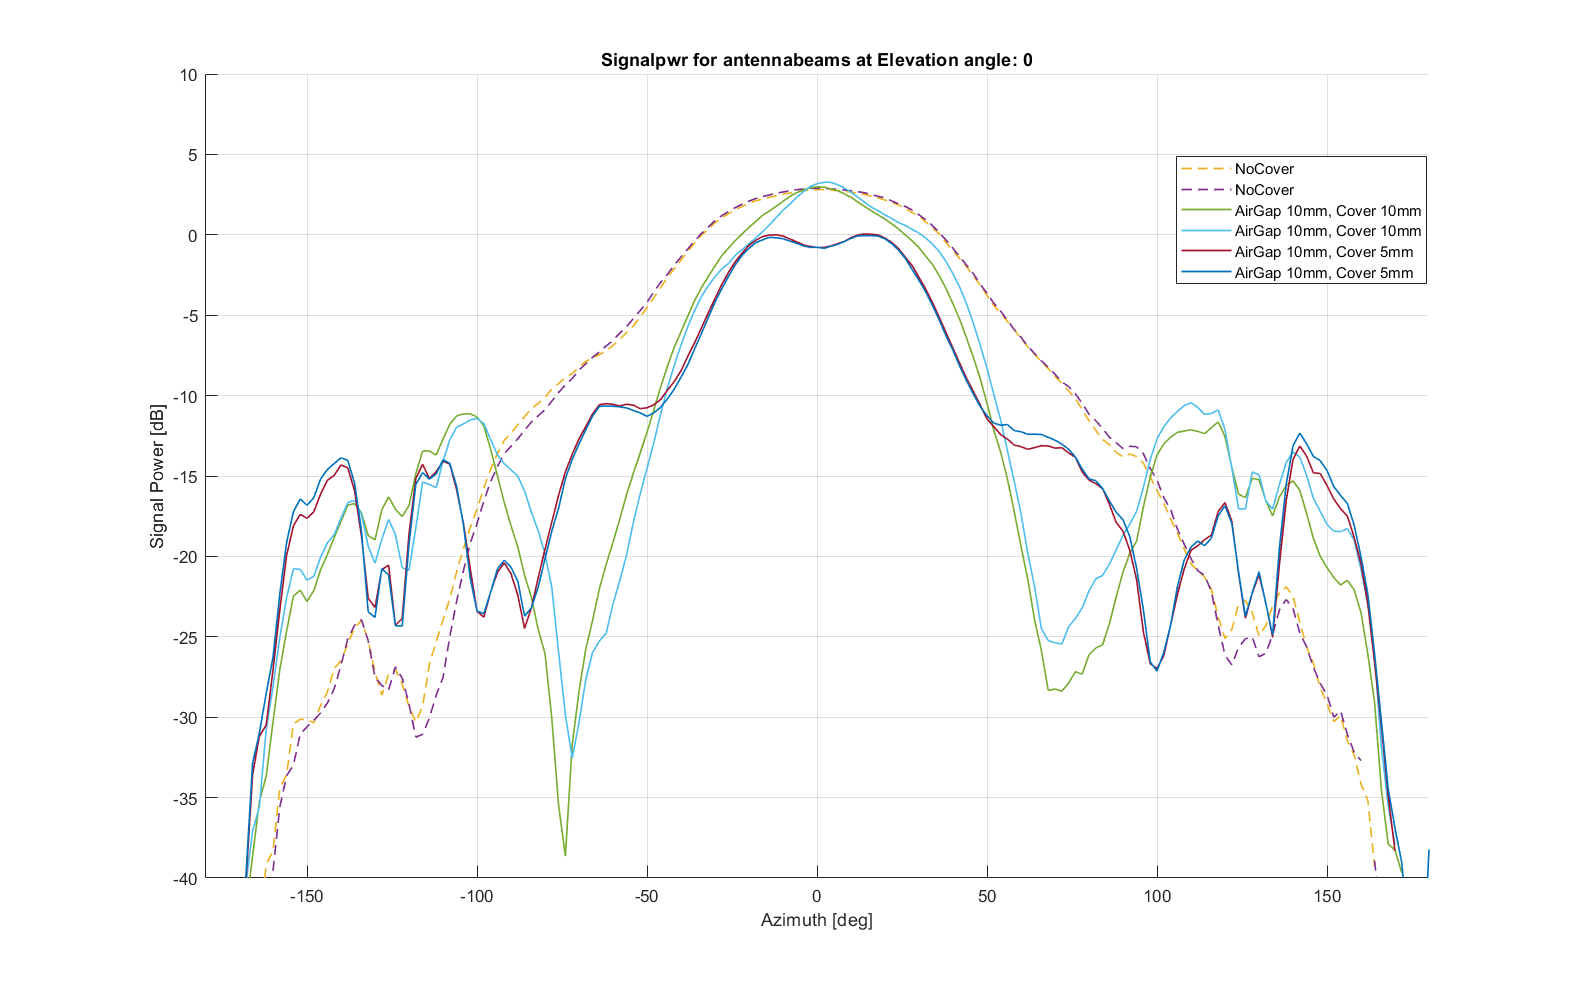
Reference, 10 and 5 mm material (2 modules)#
Airgap 20 mm (varying material thickness)
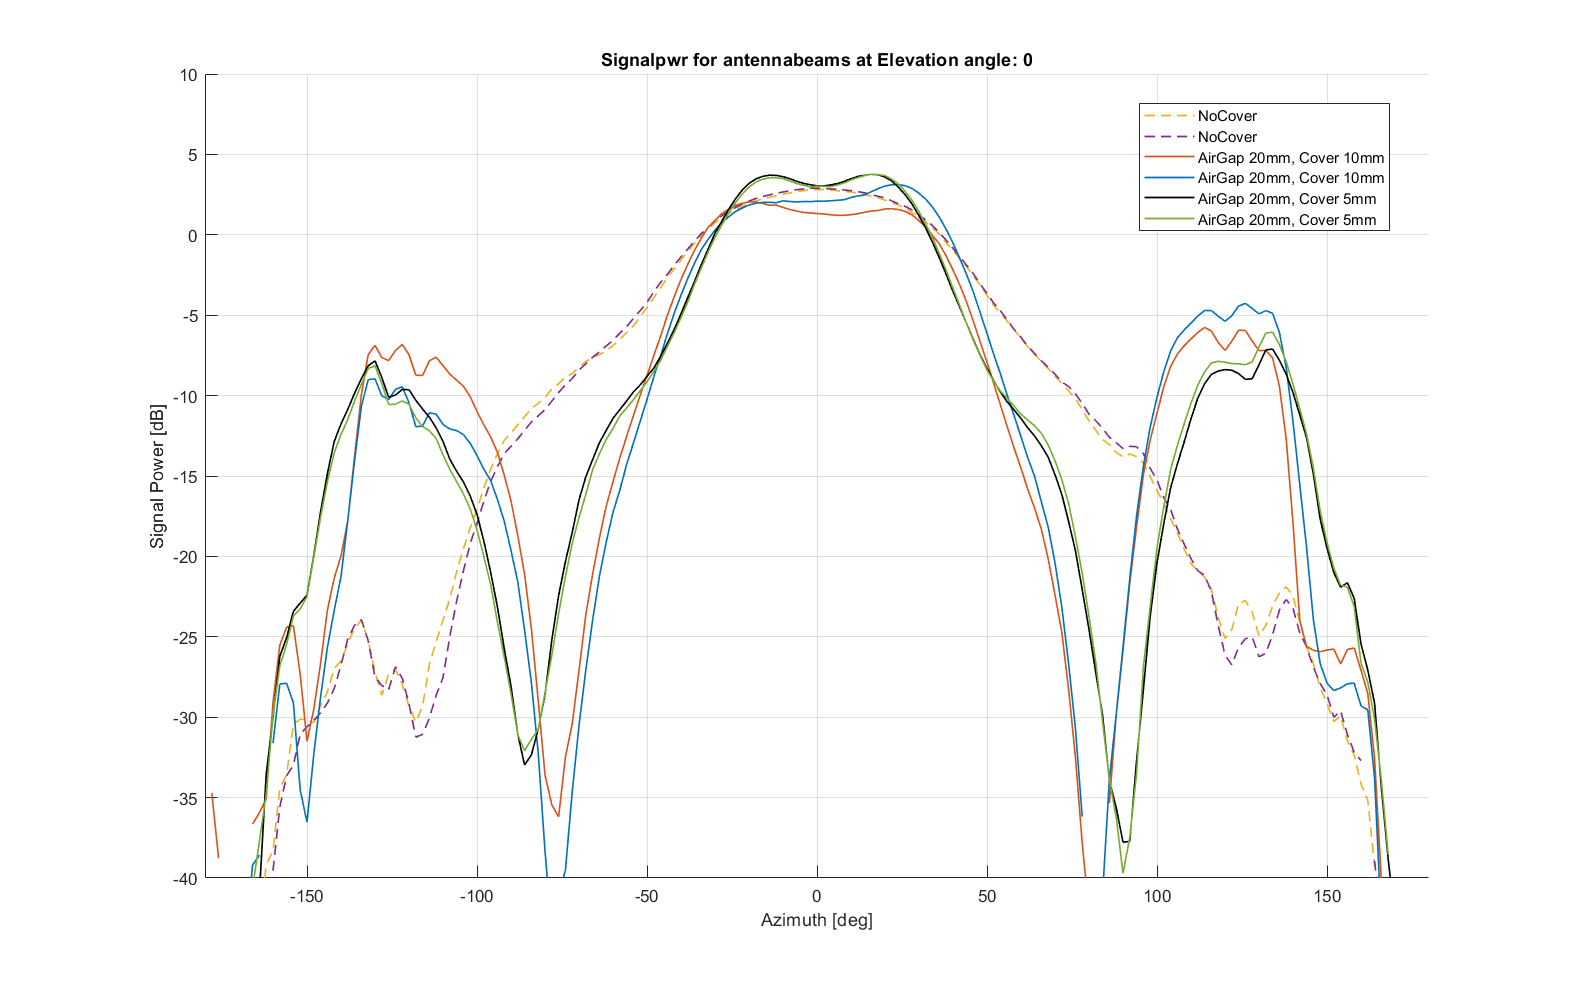
Reference, 10 and 5 mm material (2 modules)#
ABS-printed plastic 5 mm (varying airgap)
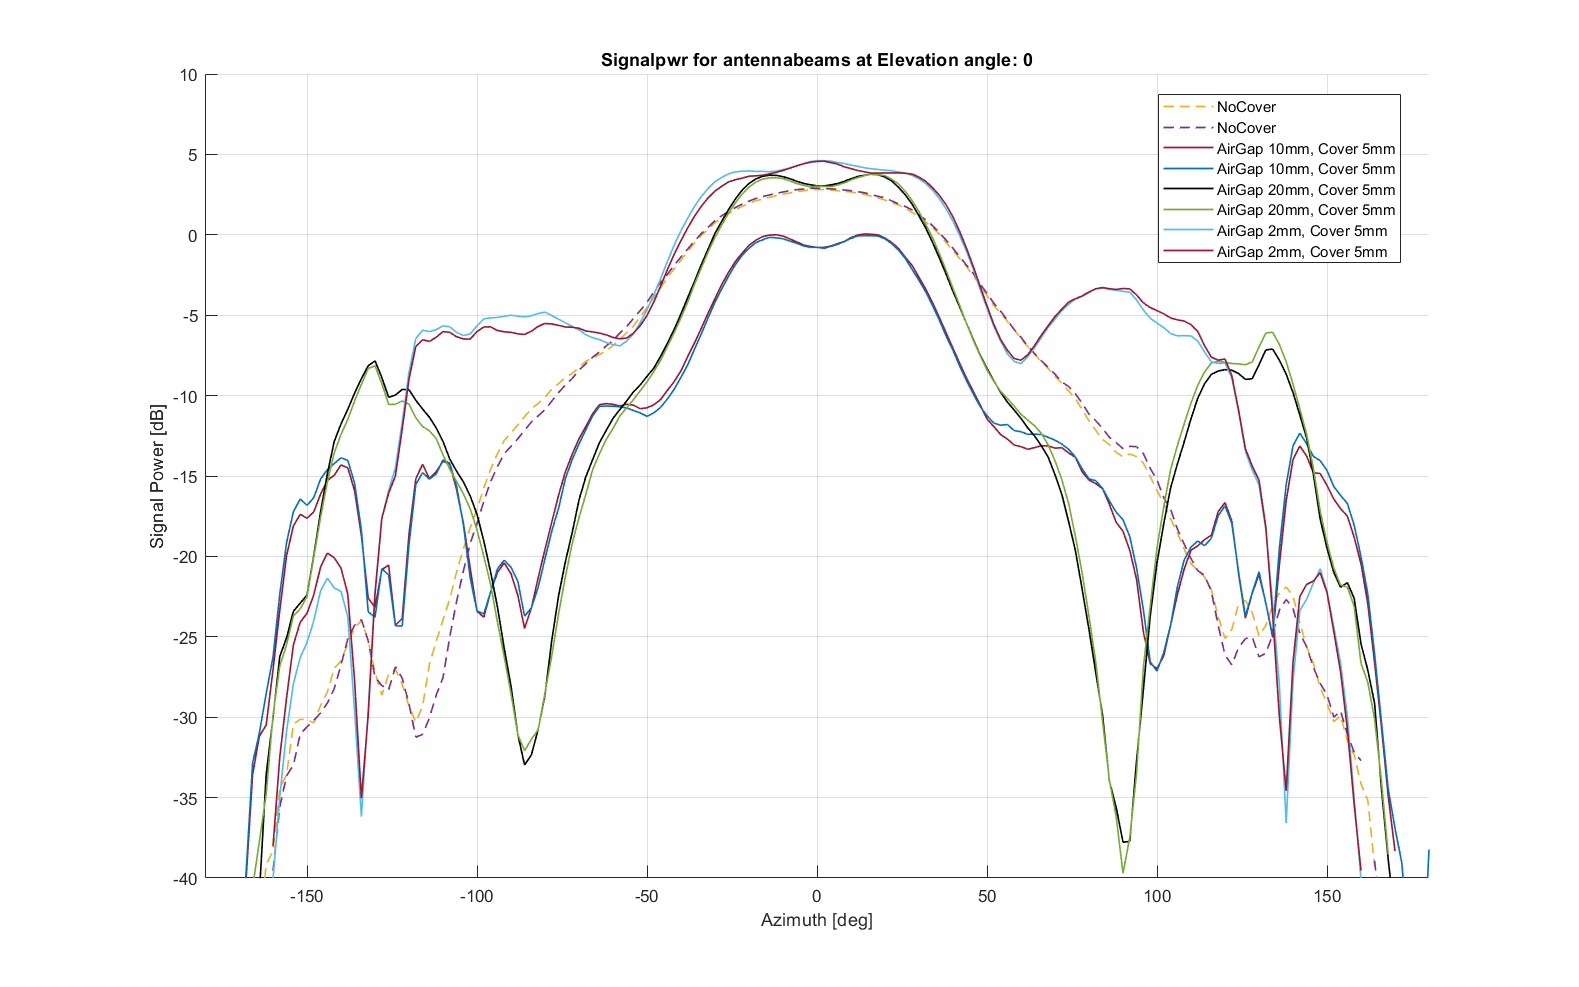
Reference, Airgap 2, 10 and 20 mm (2 modules)#
ABS-printed plastic 10 mm (varying airgap)
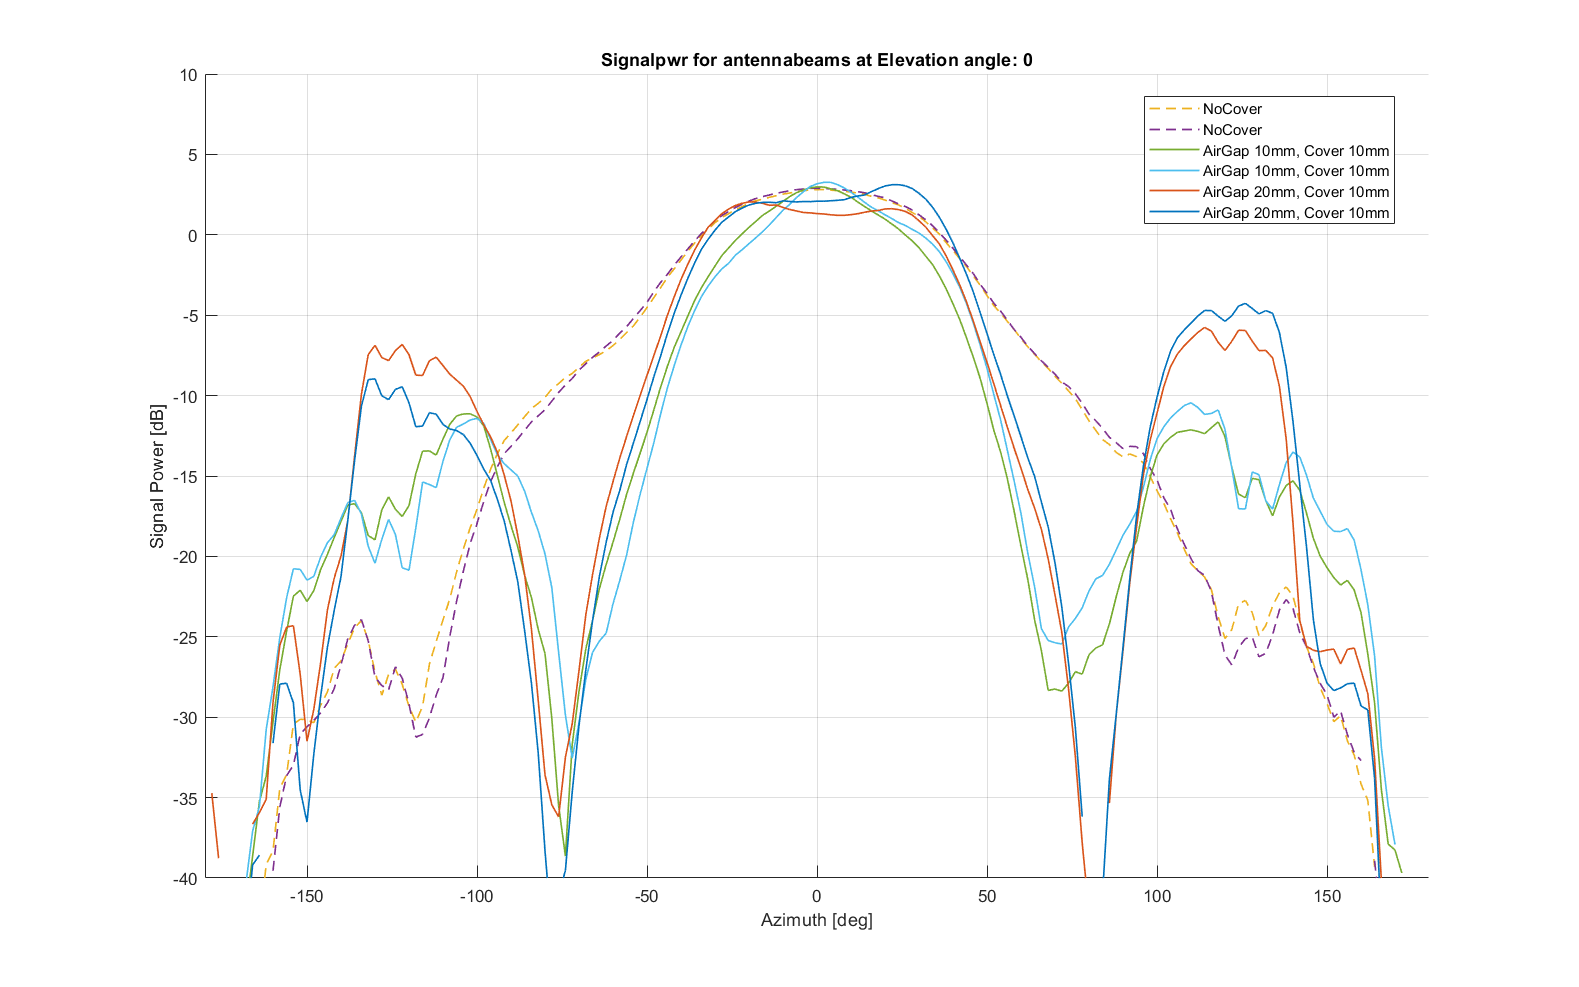
Reference, Airgap 10 and 20 mm (2 modules)#
Gorilla glass 0.5 mm (varying airgap)
Reference, 0.5 mm gorilla glass at 2, 5, 10 and 20 mm air gap#
Conclusion#
There is no specific trend of attenuation across airgap or material thickness, but rather a performance degradation when the distances appear as multiples of quarter wavelengths (slightly less than 1 cm).
5 mm thickness and air gap of 10 mm for the plastic material attenuate the signal by 3 dB. This is significant and the combination of cover thickness and distance should be avoided.
For both plastic and gorilla glass, we observe the highest attenuation with an air gap of 10 mm. It is recommended to avoid this dimension and rather use a smaller or larger value.
Ground plane size#
A PCB measuring 16x16cm was used to assess the impact of ground plane sizes on the field of view and signal strength of the X4F103 sensor. The sensor footprint was placed in both the center and upper corner of the board to examine the effect of sensor location. To determine the impact of varying ground plane sizes, the PCB size was gradually reduced by 2 cm until measuring 6 x 6 cm.
Recordings in an anechoic chamber were carried out to gather data on the sensor’s performance. The results are illustrated in the accompanying figures.
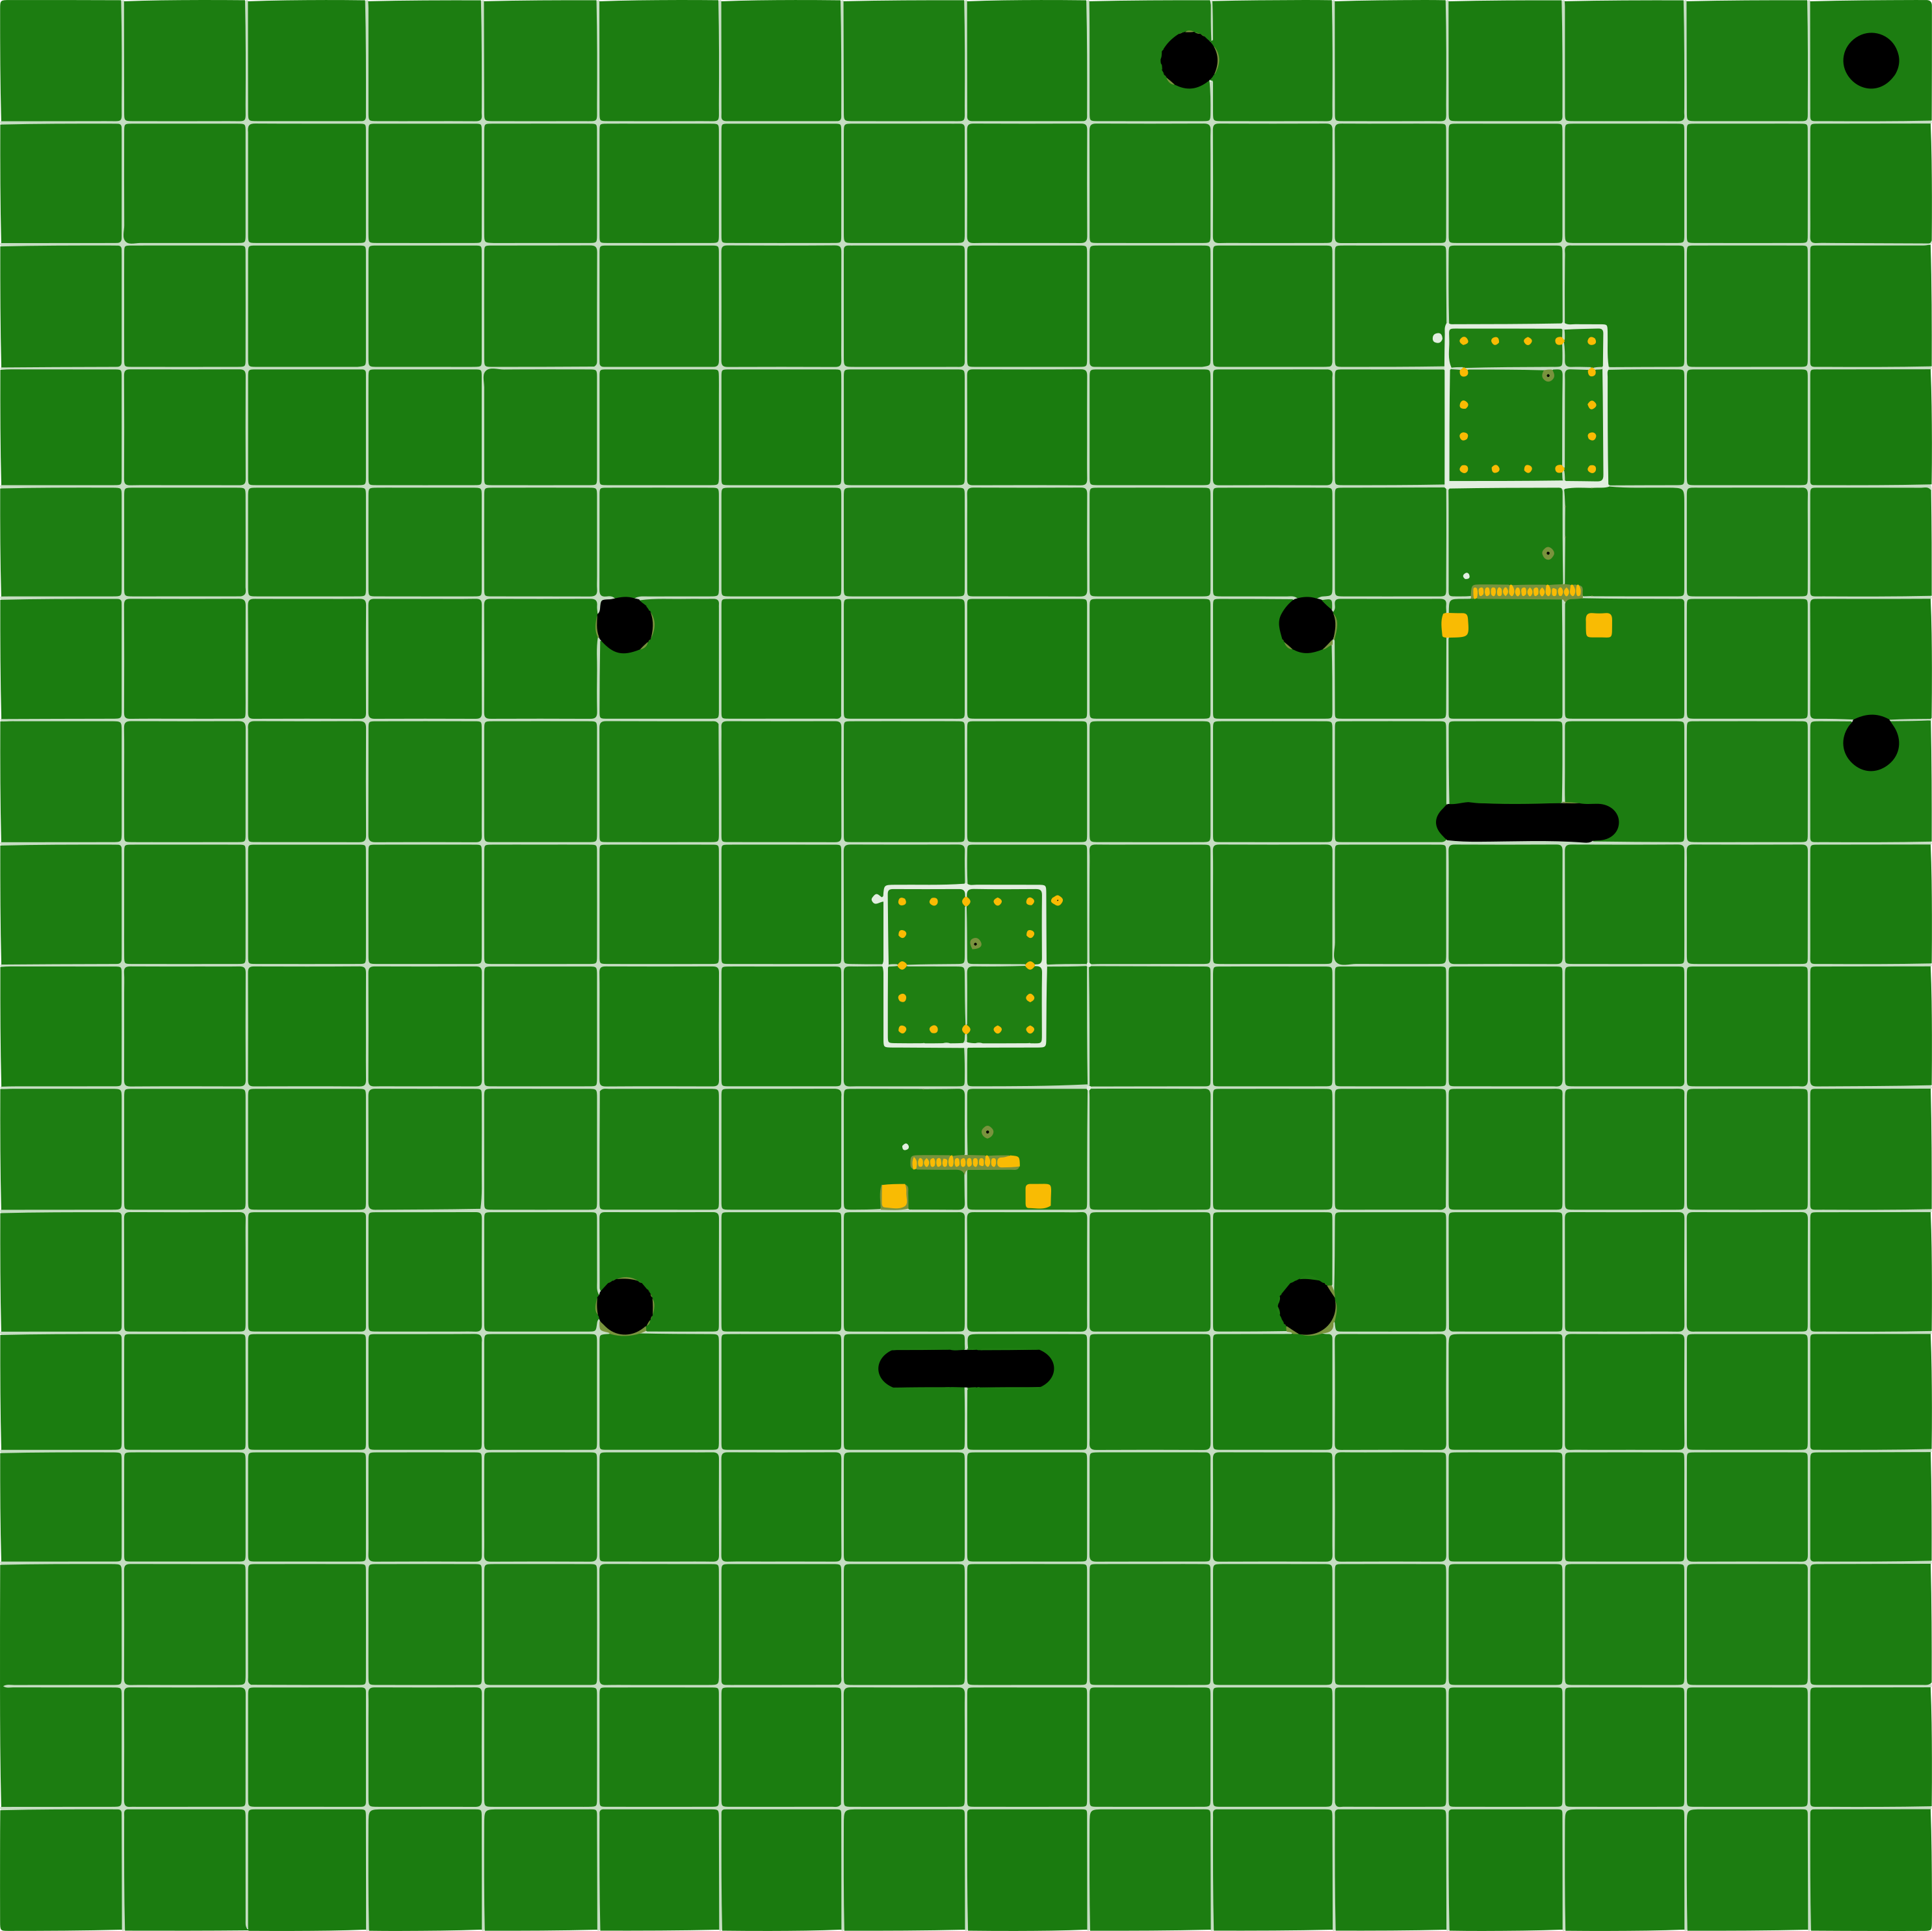
Ground plane PCB#
Results#
Symmetric and asymmetric placement of the sensor#
The plot below shows the signal strength of a calibrated radar target (spherical, rotating reflector at a fixed distance) in the azimuth plane (horizontal plane) around the sensor with the sensor mounted in the center position (blue line) and the upper right corner (orange line). The yellow plot is for a stand-alone sensor.
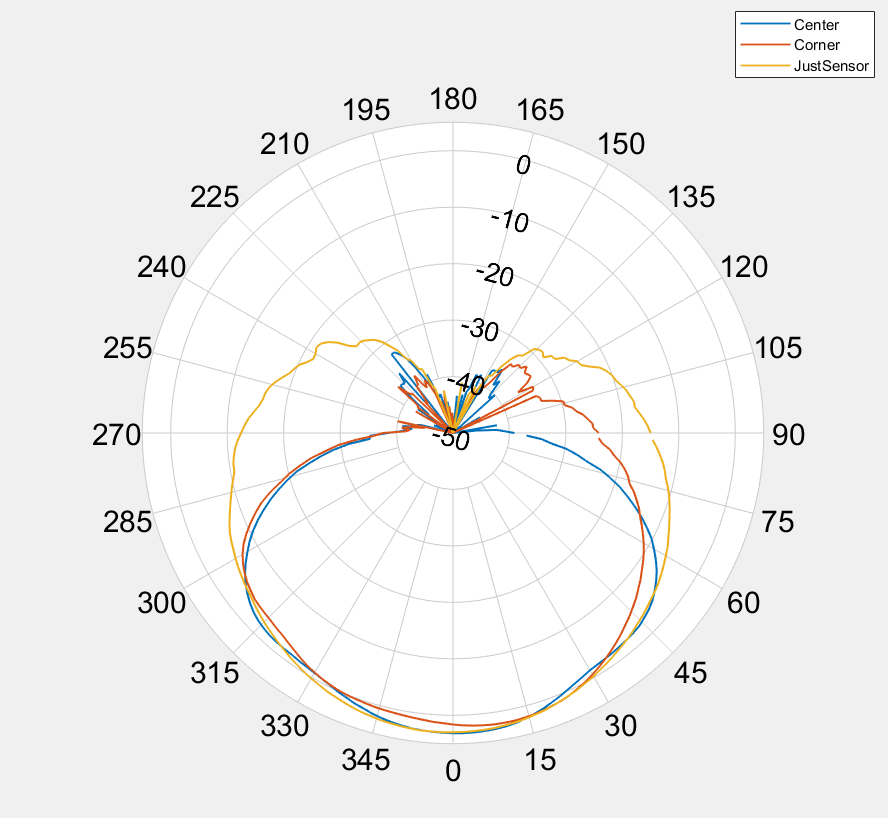
Center Mount vs. Corner Mount#
Various ground plane sizes#
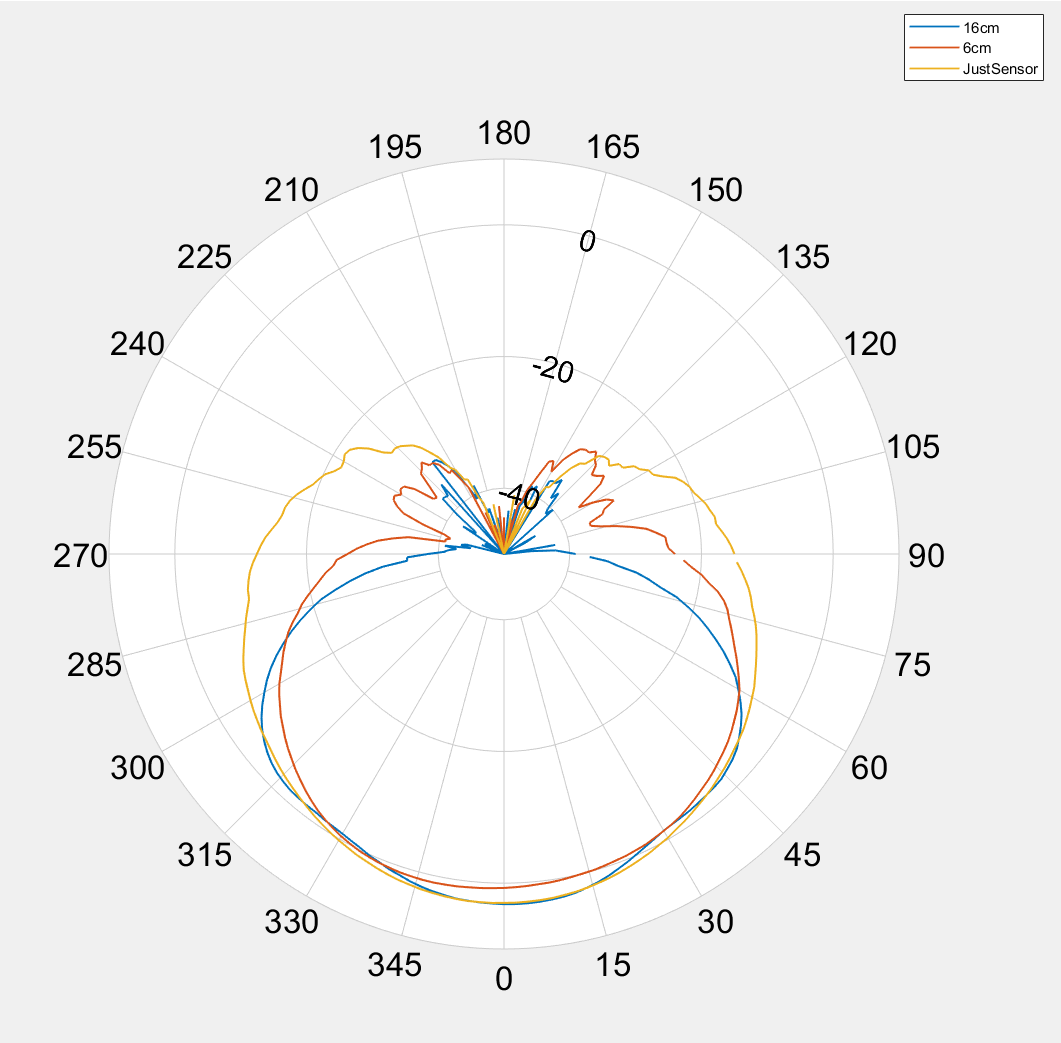
Comparison of 16 x 16 cm and 6 x 6 cm PCB. “Just Sensor” for reference.#
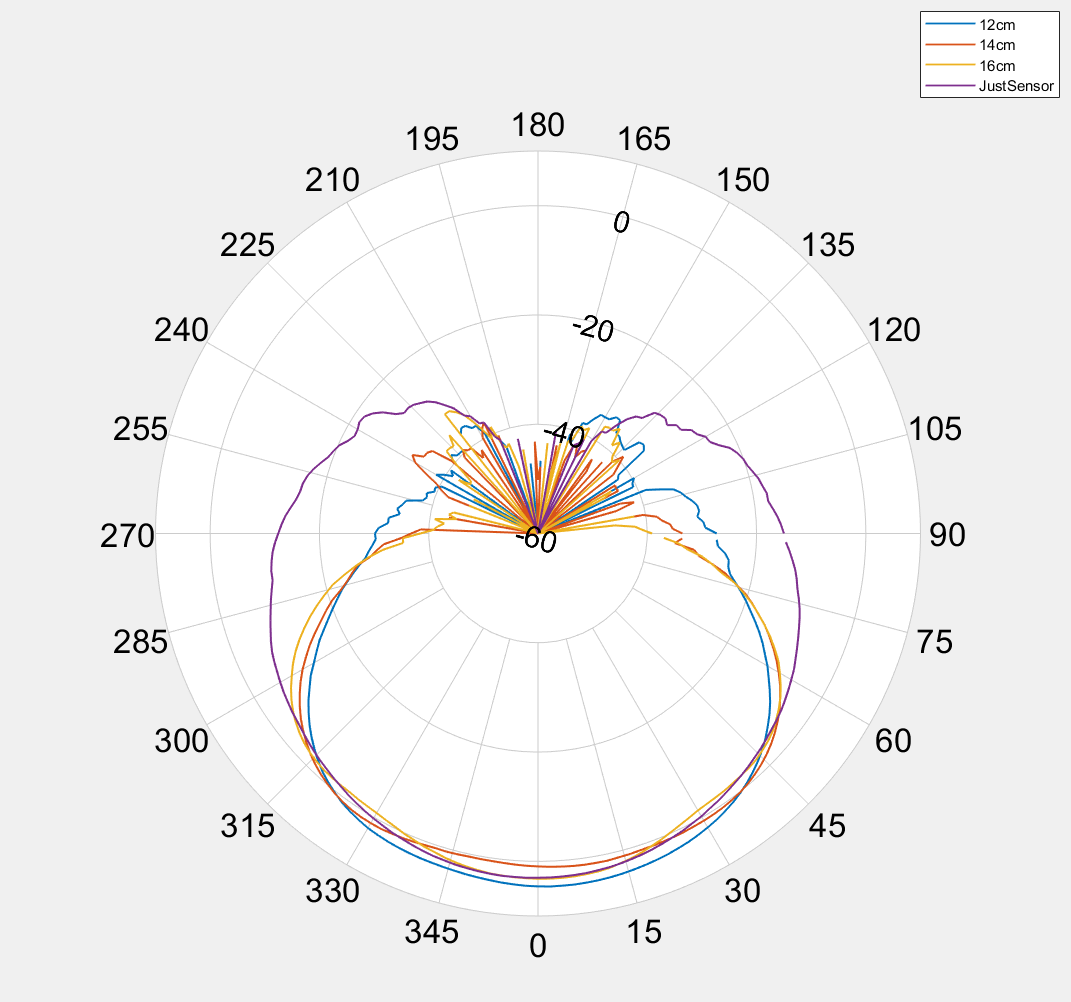
Comparison of 16 x 16, 14 x 14 and 12 x 12 cm PCB. “Just Sensor” for reference.#
Conclusion#
The signal strength is not noticeably affected within +/-45 degrees of the sensor ́s field of view.
Ground plane sizes less than 6 x 6 cm can lead to higher sensitivity in the backwards direction which in some cases can lead to detections from movement behind the sensor. If there are any metal objects behind the PCB like product housing or other mechanical parts these will typically block the backwards sensitivity.
Tall components close to the sensor#
An in-depth simulation study was performed to evaluate the effect of tall components near the X4F103 sensor. The focus of the simulation was on the module’s gain pattern and the range coverage maps for a ceiling- mounted X4F103. A rectangular component, measuring 12x10 mm and varying heights, considered tall relative to the sensor, was placed parallel to the antenna polarization along the elevation cut through azimuth 0.
The component was positioned at different distances from the sensor (10, 30 and 50 mm edge to edge) and with varying heights (1, 6 and 12 mm) of the component. As suggested by the integration guideline a 30- degree relation should be implemented between the sensor and surrounding components, hence this was also simulated
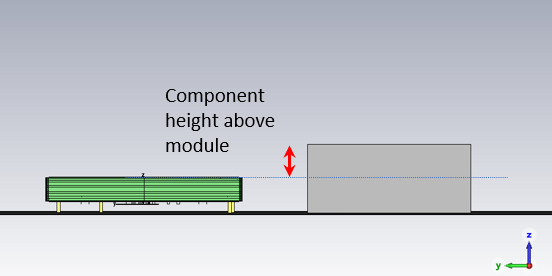
Component height relative to the module# |
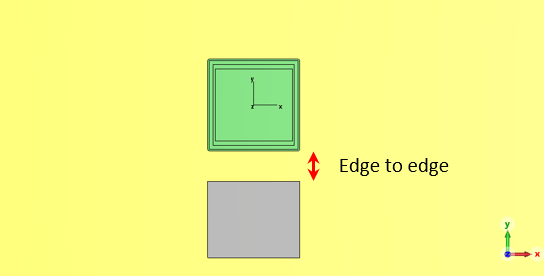
Illustration of edge-to-edge# |
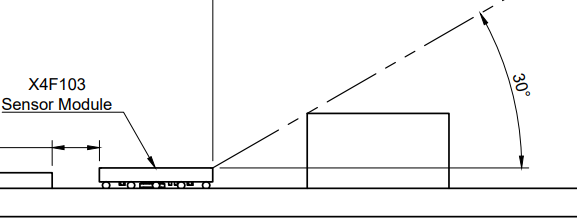
30-degree integration recommendation.# |
The results (not presented here) are in agreement with the current integration guideline suggestion with a 30- degree relation between the X4F103 module and component height is reasonable outside a distance of 10 mm from the antenna edge (edge-to-edge distance).
Wi-Fi and bluetooth interference#
Extensive testing of the X4F103 sensor was performed to evaluate possible signal interference from Wi-Fi and Bluetooth signals. The test setup is shown in the figure below. Worst-case scenarios with high Bluetooth (20 dBm) and Wi-Fi (15 dBm) signal strength were tested with various frequencies and modes (continuous and pulsed signal).
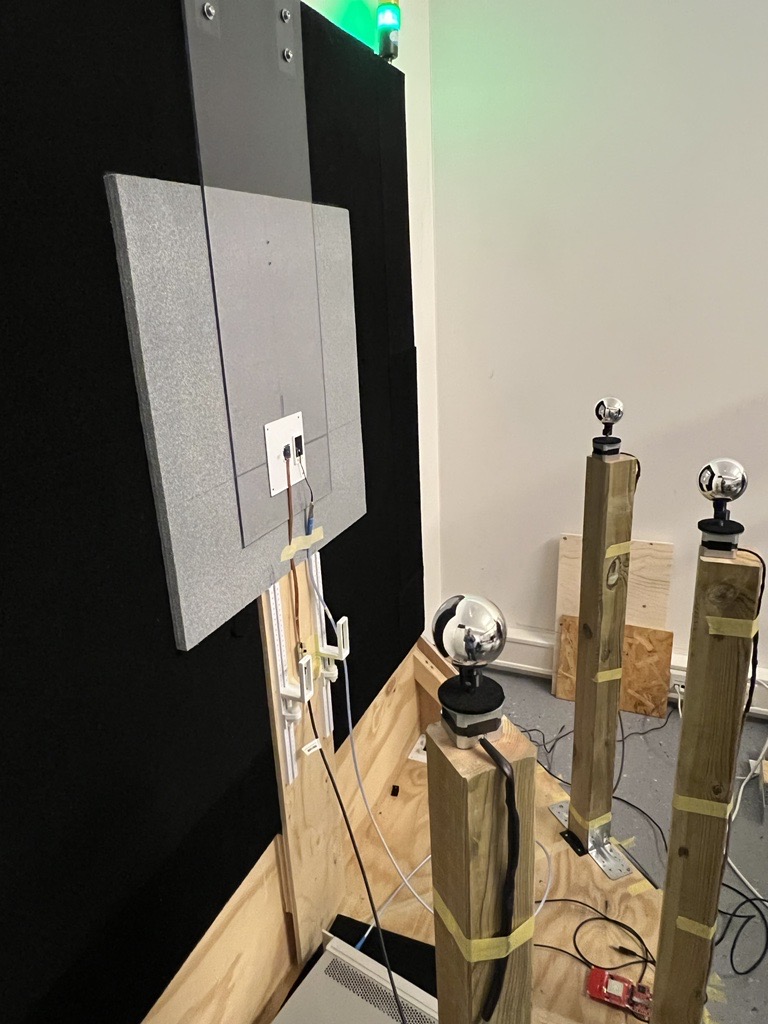
The test station with X4F103 and interferer antenna are 6 cm apart on the left wall and the radar reflectors are to the right. The target reflections correspond to the breathing motion of a human.#
Results#
The results show an increase in interference the closer the Wi-Fi frequency is to the frequency band of X4F103.
Bluetooth (2.4 GHz) and Wi-Fi below approximately 6 GHz have not been shown to cause interference. Increased Wi-Fi frequency gradually increases the noise floor of the X4F103.
Below is an example of mean signal power with continuous Wi-Fi of 15 dBm (one -20 dBm measurement for reference) and the Proximity Indoor algorithm. With 2.48 and 5.825 GHz Wi-Fi, the noise floor is considered normal and the range and sensitivity will remain as expected as if under non-Wi-Fi conditions.
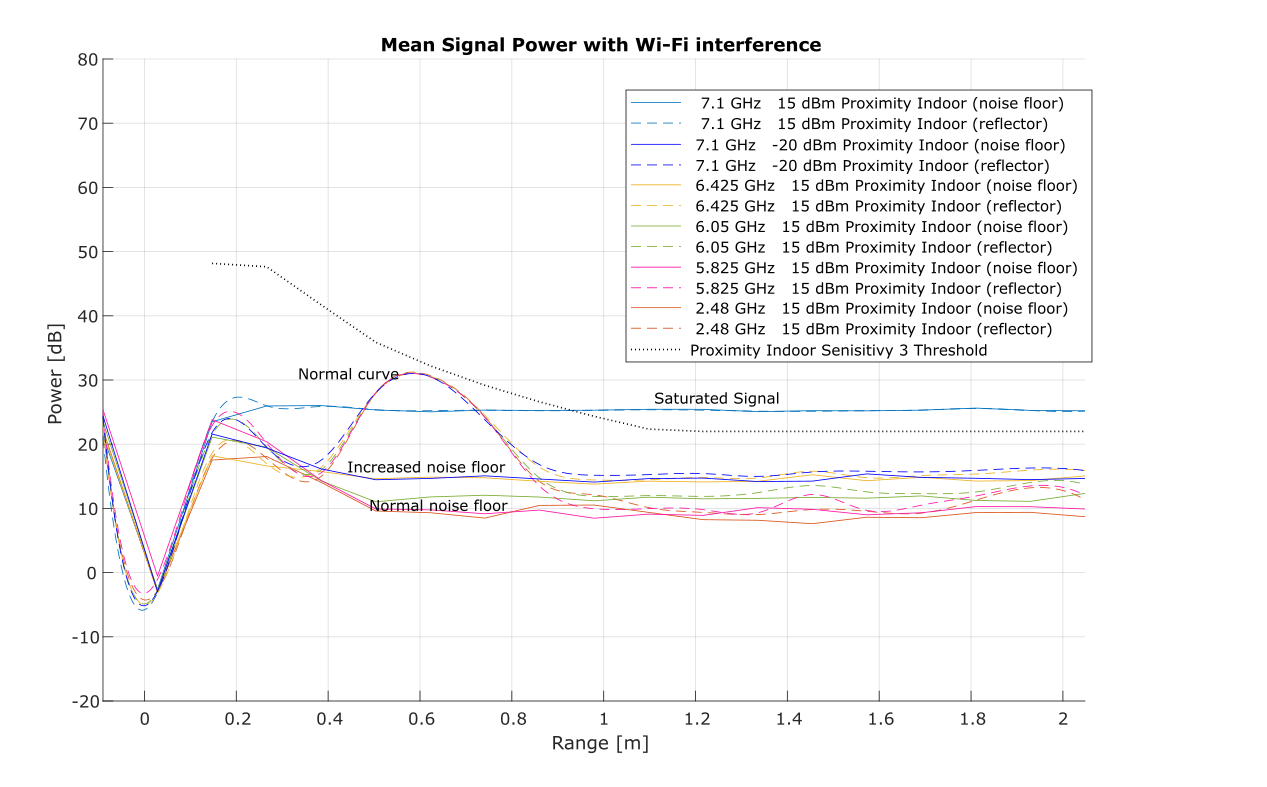
Mean Signal Power over range with Wi-Fi interference of different frequencies at 15 dBm. Includes a 7.1 GHz and -20 dBm measurement.#
The increased noise floor caused by Wi-Fi interference can lead to two problems in sensor applications: false detections and reduced range. False detections happen when the noise floor gets too close to detector thresholds, allowing random noise peaks to falsely trigger the sensor. Reduced range occurs due to a loss in signal-to-noise ratio (SNR), which prevents the sensor from detecting targets within the configured range.
For 7.1 GHz Wi-Fi at 15 dBm (worst measured scenario), the signal is saturated and at 1 m range the noise floor is above the Sensitivity 3 threshold For Proximity Indoor.
False detections
Wi-Fi frequencies up to 6.425 GHz (15 dBm) and 7.1 GHz ( -20 dBm) yield an SNR (Signal-to-noise ratio) reduction of approximately 5 dB at the 1 m range in this specific case. For Proximity Indoor, with a 3 dB gap between sensitivity levels, this means a potential loss of 1-2 sensitivity levels. In this case, the noise floor is approaching the threshold of sensitivity 5, and false detections are likely at the highest sensitivity settings.
For Occupancy, the gap between the sensitivity levels is 1.5 dB and there is hence a potential loss of 3 sensitivity levels.
Reduced range
Detections require a minimum SNR. Typically for Proximity and Occupancy up to a 3 m range, targets will have a significant SNR margin due to high signal strength. For occupancy above 3 meters, target signal power is lower and increased noise will thus reduce the SNR margin. Increased noise may therefore affect the effective detection range.
X4F103 Integration recommendations with Wi-Fi 6, 6e and 7 (above 6.2 GHz)#
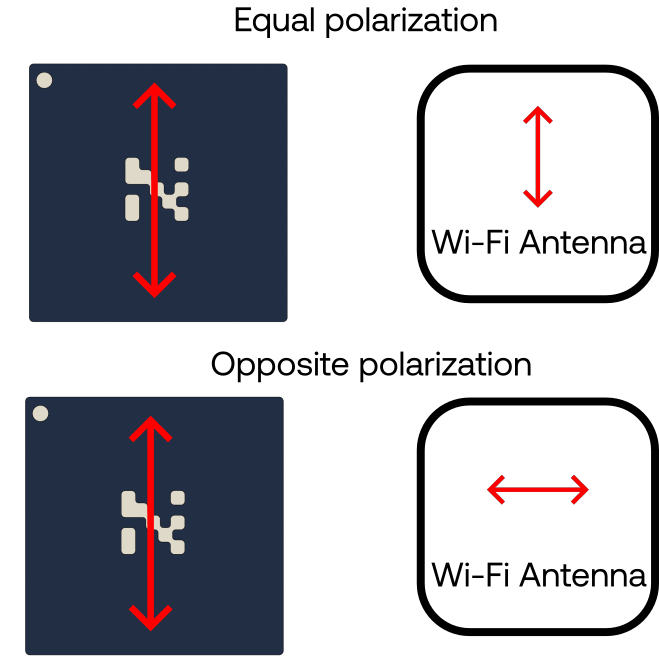
Orientation of polarization of Wi-Fi antenna with respect to the X4F103 antenna
Equal polarisation increases the probability of signal interference. Opposite polarisation decreases signal interference significantly.
The test station with X4F103 and interferer antenna are 6 cm apart on the left wall and the radar reflectors are to the right. The target reflections correspond to the breathing motion of a human.#
Distance between the Wi-Fi antenna and the X4F103 sensor
Increase the distance between the sensor and the Wi-Fi antenna to decrease signal interference. The distance is dependent on the Wi-Fi frequency.
Signal Power output from Wi-Fi antenna
Reduce the signal power from the Wi-Fi antenna to reduce interference.
Sensor orientation in oblong lamp fixtures#
Due to a slightly asymmetrical antenna pattern, be carefull when integrating X4F103 in lamp fixtures with an oblong geometry. Hence, we recommend to orient the sensor normal to the “long-side” of the fixture, illustrated in the first figure below.
If the measured range is shorter than the expected range, move the sensor 0.5 - 1 cm away from/out of the fixture.
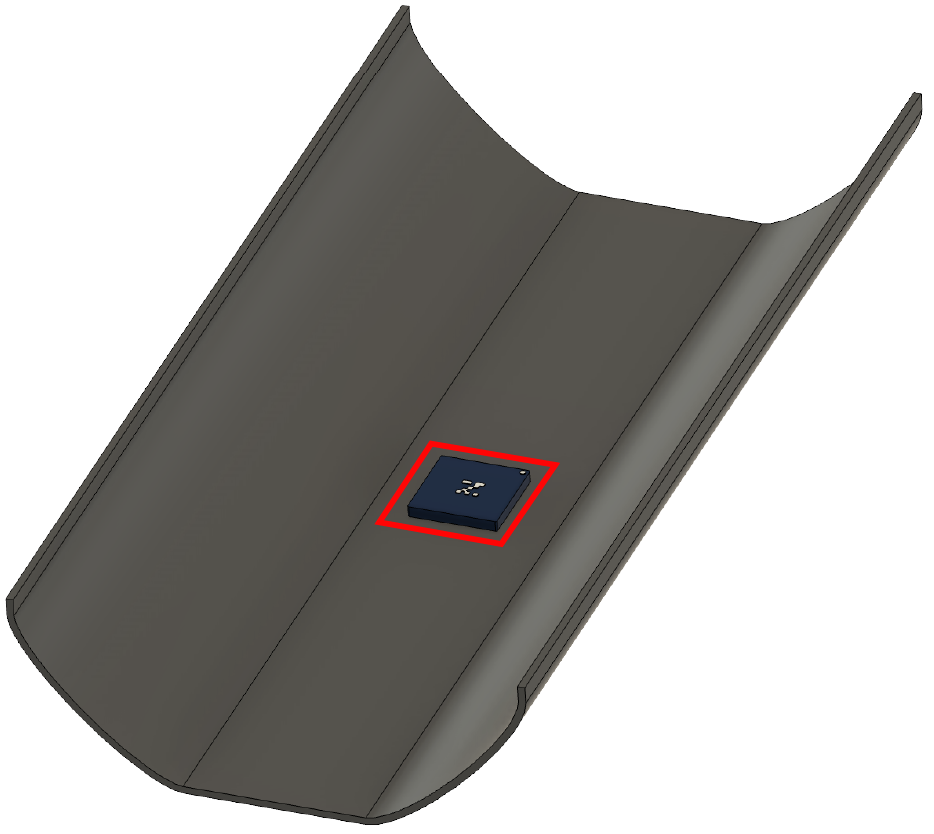
Recommended: The Novelda logo, N, orientend normal to the lamp fixture’s long-side.#

Avoid: The Novelda logo, N, orientend parallell to the lamp fixture’s long-side.#